Coiled For A Move

How should the price action segment (at left) be marked up?
There are several Wyckoff analysis lessons and at least one empirical observation (made over several decades) in just the 16-bars of price action.
Empirical Observation
In a sense the prior update on Carvana (CVNA) illustrates the point.
When price action gets tight, something’s about to happen.
When that analysis was presented, little did we know, ‘Hindenburg‘ would come out and whack the stock.
So, let’s move on and mark up the chart … which just so happens to be the Russell 2000 ETF, IWM.
Russell 2000, IWM, Daily
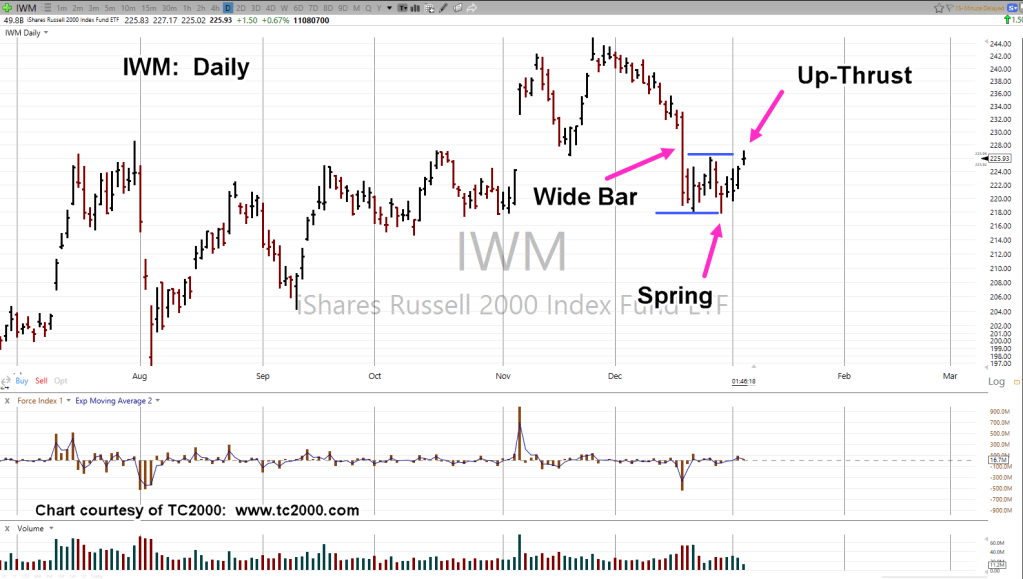
The wide high-volume bar has been ‘tested’.
Price action penetrated lows posted December 20th; currently in spring condition that has (today) just posted into an up-thrust condition.
Repeating Pattern
From the late Wyckoff expert and mentor David Weis, spring-to-up-thrust is a repeating set-up, link here.
Stay Tuned
Charts by StockCharts
Note: Posts on this site are for education purposes only. They provide one firm’s insight on the markets. Not investment advice. See additional disclaimer here.
The Danger Point®, trade mark: No. 6,505,279

Pingback: Russell, Goes Off-The-Rails « The Danger Point®
Pingback: Russell 2000, Breakdown « The Danger Point®