Hourly Numbers

When you add it all up, if the SOXX was going to reverse from all-time highs into a sustained correction, Friday’s close would be a good place to start (not advice, not a recommendation).
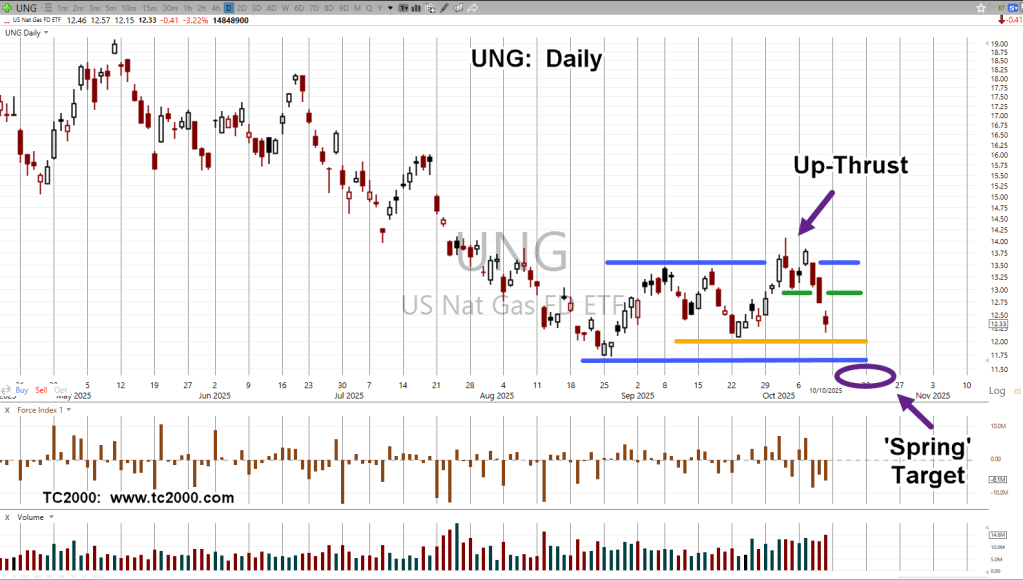
Prior updates have been consistent with the (Wyckoff) premise, upward thrusts are covering less net distance.
SOXX Hourly Details
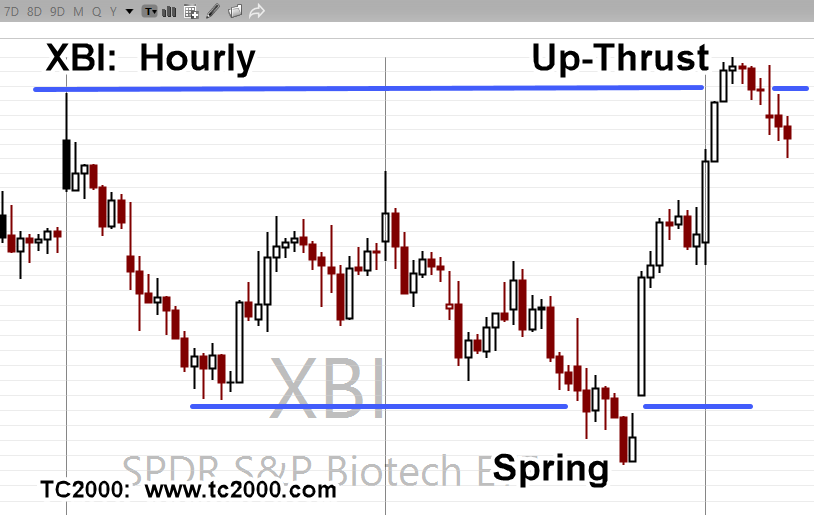
First, the markets are fractal.
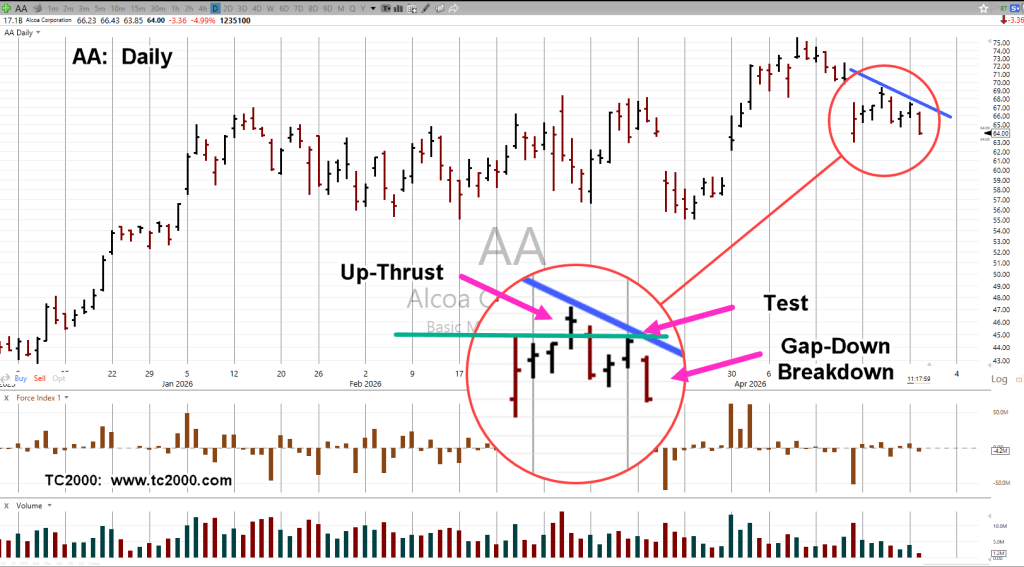
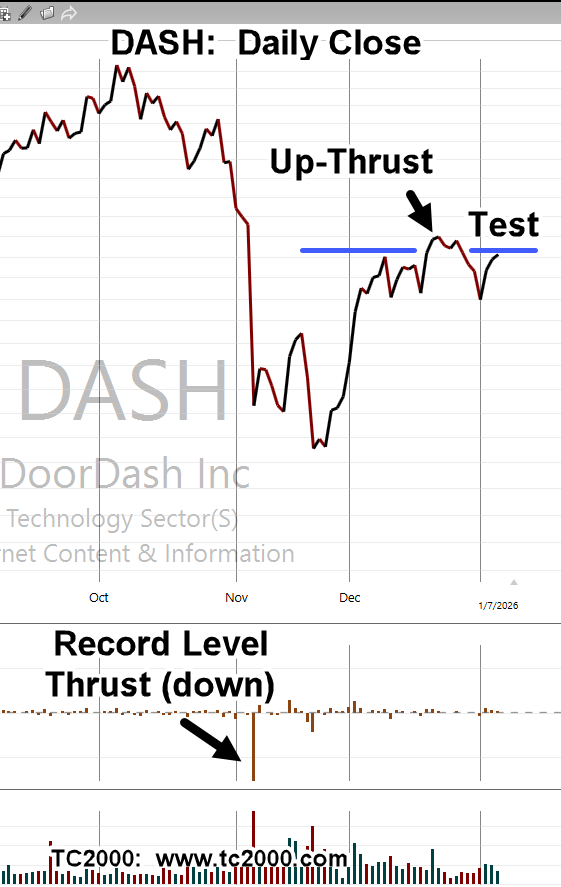
We see the same repeating pattern of ‘spring to up-thrust’, on the hourly as on longer timeframes.
Second, tops and bottoms are different.
The characteristic of the ‘spring’ bottom and the ‘up-thrust’ top are how markets behave.
Bottoms, ruled by fear, typically sharp and well defined.
Tops, ruled by hope, typically wide and rounded.
Semiconductors SOXX, Hourly
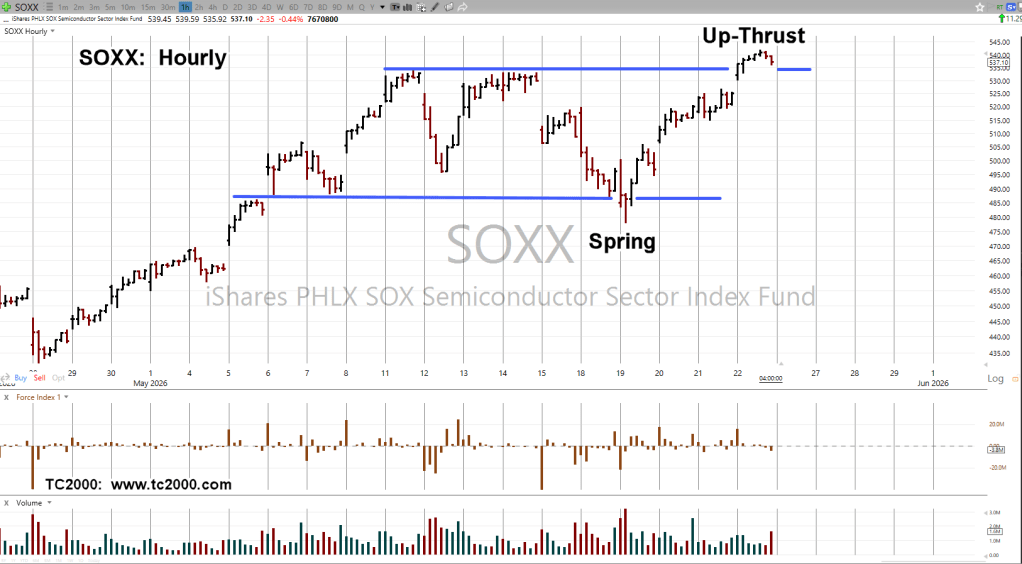
The top shown above, is what David Weis used to call, The Danger Point®, where risk (cost) of being wrong (on a short, in this case), is least.
In his video, he points out this type of action, saying ‘the market could just keep on going … so what’.
His meaning was, it’s the point where there’s instability, therefore, potential for reversal (not advice, not a recommendation).
For those who don’t have that video, it is timeless wisdom, still available here.
Stay Tuned
Charts by StockCharts
Note: Posts on this site are for education purposes only. They provide one firm’s insight on the markets. Not investment advice. See additional disclaimer here.
The Danger Point®, trade mark: No. 6,505,279