Note: Posts on this site are for education purposes only. They provide one firm’s insight on the markets. Not investment advice. See additional disclaimer here.
Note: Posts on this site are for education purposes only. They provide one firm’s insight on the markets. Not investment advice. See additional disclaimer here.
Note: Posts on this site are for education purposes only. They provide one firm’s insight on the markets. Not investment advice. See additional disclaimer here.
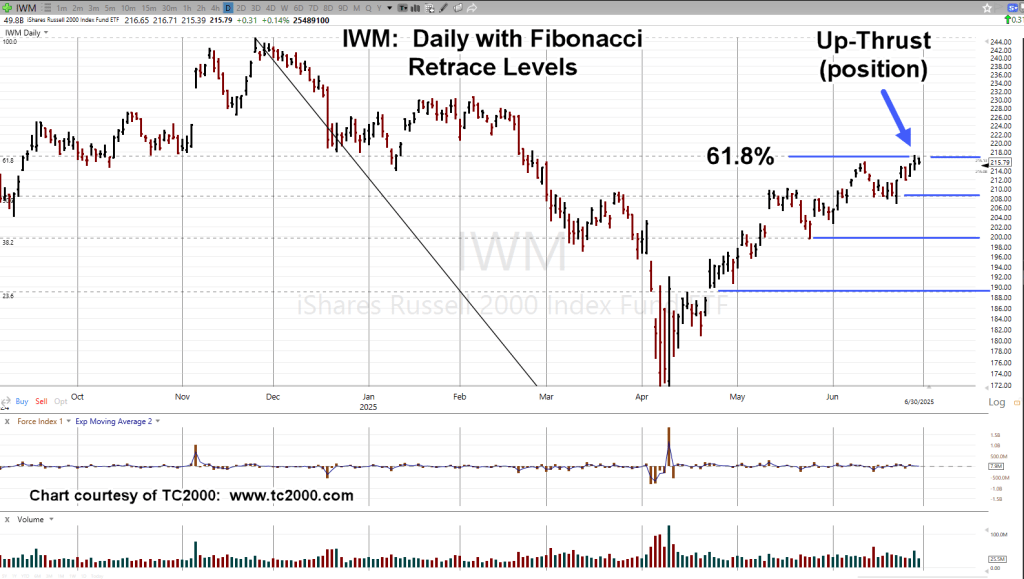
The Russell 2000 has been recovering (along with the rest of the major indices) from the lows posted on April 7th, and 9th, this year.
What the index has not done, unlike the Qs, and the S&P is post new-all-time highs.
At this juncture, tracking fund IWM, is at a Fibonacci 61.8%, retrace, and giving just a hint, it might be finished with further upside.
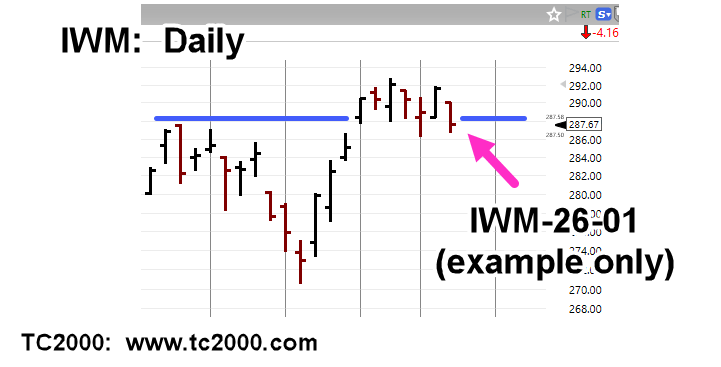
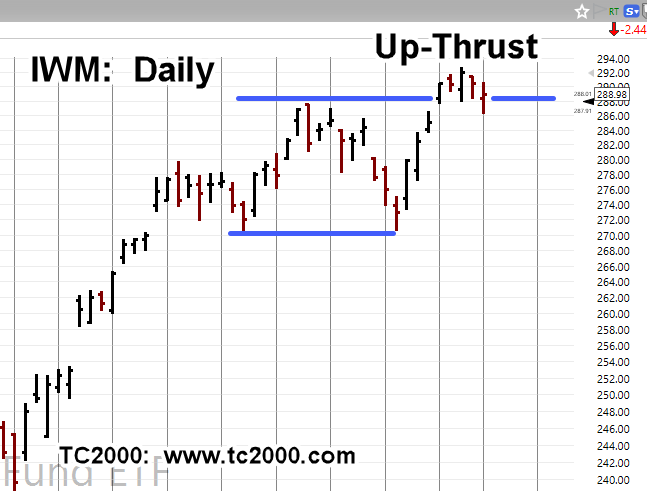
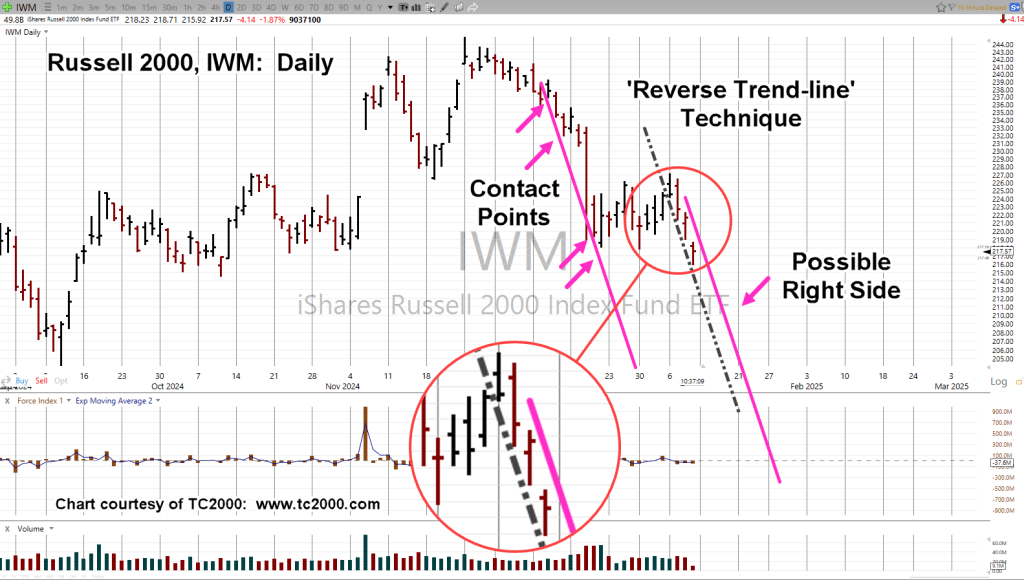
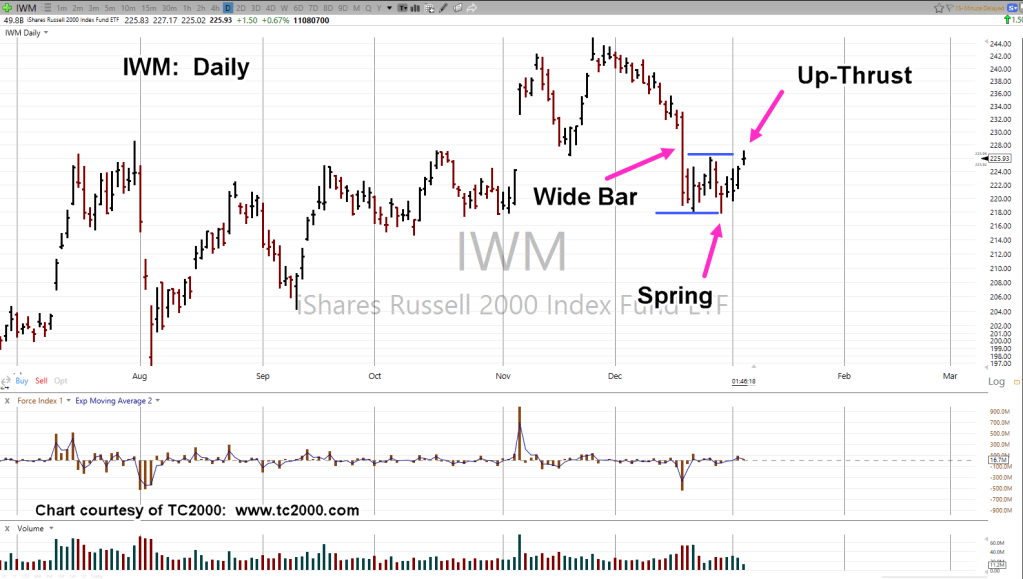
Russell 2000 ETF, IWM, Daily
As the chart notes, we’re in up-thrust ‘position’; meaning, there’s no new daily low to help confirm a potential reversal.
As presented many times in previous posts:
‘In the markets, you’re either early, or late’.
Upside risk (on a short) is set at last Friday’s IWM high; risk is low (but not zero).
With that said, a short position was opened (after-hours session, yesterday) in the IWM, via leveraged inverse fund TZA, trade TZA-25-03 (not advice, not a recommendation).
Note: There was no ‘new daily low’ in the IWM tracking fund to ‘confirm’.
However, in the pre-market, IWM is trading lower at 214.72, and threating to post a new daily low at 214.13.
Open Positions
At this juncture, 8:50 a.m., EST, open positions are as follows (not advice, not a recommendation).
Short Wal-Mart: WMT-25-03, Stop @ 98.16
Short Tractor Supply Co.: TSCO-25-01, Stop @ 52.93
Note: Posts on this site are for education purposes only. They provide one firm’s insight on the markets. Not investment advice. See additional disclaimer here.
Over and again, this sector (IBB, XBI) is not participating in tandem with the other major indices.
Today’s pre-market mayhem higher over supposed slower outlays of possible trade tariffs to happen some-time, some-day, caused the major indices to launch upward. 🙂
Well, everybody seemed to be blasting higher except one sector, biotech.
Wyckoff Directed Action
No matter what the ‘narrative’ may be, Wyckoff analysis directs us to look at what the market is actually doing, then interpret the action.
Early after the open, trade TZA-25-01, was exited, +8.9% gain, short position opened in biotech via LABD, Trade: LABD-25-01 (not advice, not a recommendation).
Biotech XBI, Daily
Today posted outside down, taking out both the high and low of the prior session.
Note the trading channel and width, Fibonacci 13-Days.
Also note the two ‘breakaway gaps’. The second one on January 10th, much wider than November 12th, last year.
Note: Posts on this site are for education purposes only. They provide one firm’s insight on the markets. Not investment advice. See additional disclaimer here.
Note: Posts on this site are for education purposes only. They provide one firm’s insight on the markets. Not investment advice. See additional disclaimer here.
Note: Posts on this site are for education purposes only. They provide one firm’s insight on the markets. Not investment advice. See additional disclaimer here.
Note: Posts on this site are for education purposes only. They provide one firm’s insight on the markets. Not investment advice. See additional disclaimer here.
We’ve gone form “Not Happening” to this morning’s action; ‘maybe it’s happening?’
As was done with Oil & Gas exploration XOP, we’ll now take a look at the oil patch itself and proxy, USO.
Oil tracking Fund, USO, Close
“What do you see?”
Marking up the chart.
We either have the ‘tradable bounce‘, or a potential contact point for the right-side channel line (not advice, not a recommendation).
The Fed announcement is just out, essentially accommodating a rate cut in September.
There was talk of some ‘cooling’ in the market (Ya think?).
With that, demand for oil seems like it would take a hit putting it lightly (not advice, not a recommendation).
Positioning.
The market itself is telling us where to go and what to do.
The important item for the day; what is the market not doing? Specifically, the Semiconductors, SOXX.
The SOXX, has not made a new (daily) high (at least, not yet) after the Fed’s announcement; it can even be seen as the ‘proverbial gut-check’, a la David Weis.
With that, all other positions have been closed save the short in the semiconductors via inverse fund SOXS (not advice, not a recommendation).
Danger Ahead
The ‘rate cut’ has yet to happen and September is a long way away.
It can’t be re-iterated enough how dangerous is this environment; prices stretched via a narrative that’s false (not advice, not a recommendation).
Note: Posts on this site are for education purposes only. They provide one firm’s insight on the markets. Not investment advice. See additional disclaimer here.
Note: Posts on this site are for education purposes only. They provide one firm’s insight on the markets. Not investment advice. See additional disclaimer here.