Is This (finally) It?

As a reminder, this update said we may be at the end of the short-covering rally from the April lows.
That’s proven to be correct (so far).
From the same update, we have the weekly Fibonacci correlation at 55 weeks between highs.
With that said, let’s look at the chart.
Semiconductors SOXX, Hourly
We’re using the shorter timeframe as the flag is not that easily seen on the daily chart.
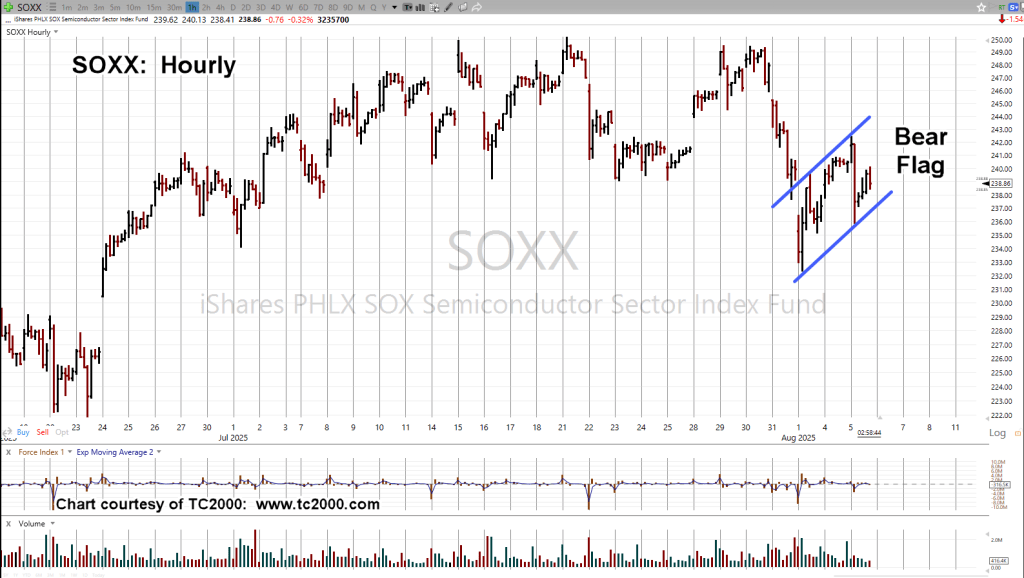
Currently positioned short as SOXX-25-09, with the stop at today’s high (not advice, not a recommendation).
Stay Tuned
Charts by StockCharts
Note: Posts on this site are for education purposes only. They provide one firm’s insight on the markets. Not investment advice. See additional disclaimer here.
The Danger Point®, trade mark: No. 6,505,279

Pingback: Another ‘Bear Flag’, in The SOXX « The Danger Point®