Most, Since June of 2010
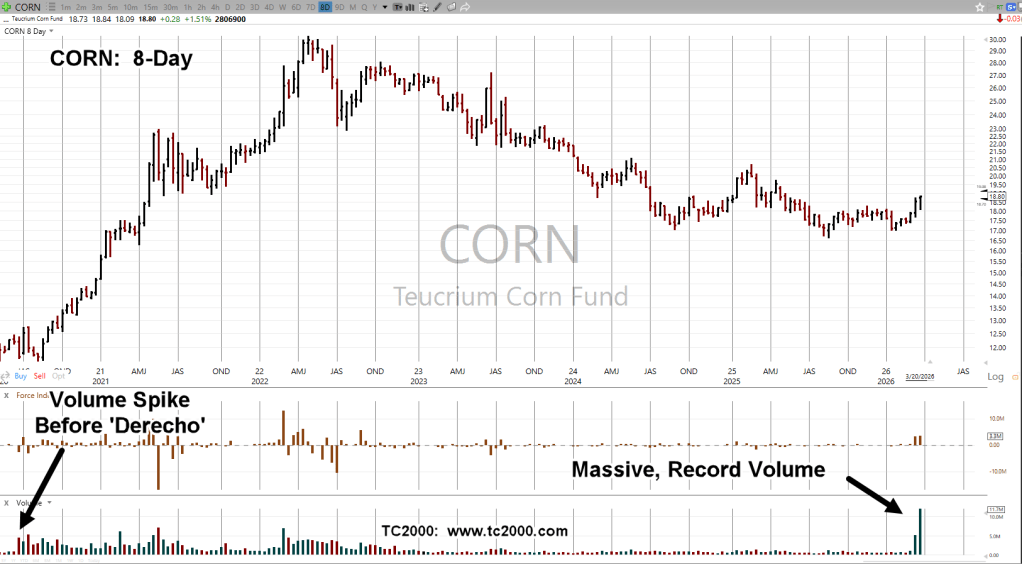
There’s massive volume in the Teucrium CORN, tracking fund.
The chart at left, is a Fibonacci 8-Day, with four more days to go before the current bar is complete.
The last time there was volume anywhere close to this, was back in June of 2020, several weeks before 10% of the U.S. corn crop was wiped out by an inland ‘hurricane’.
That incident launched a rally in CORN, lasting into the early part of 2022, gaining over 160% (not advice, not a recommendation).
Stay Tuned
Charts by StockCharts
Note: Posts on this site are for education purposes only. They provide one firm’s insight on the markets. Not investment advice. See additional disclaimer here.
The Danger Point®, trade mark: No. 6,505,279
