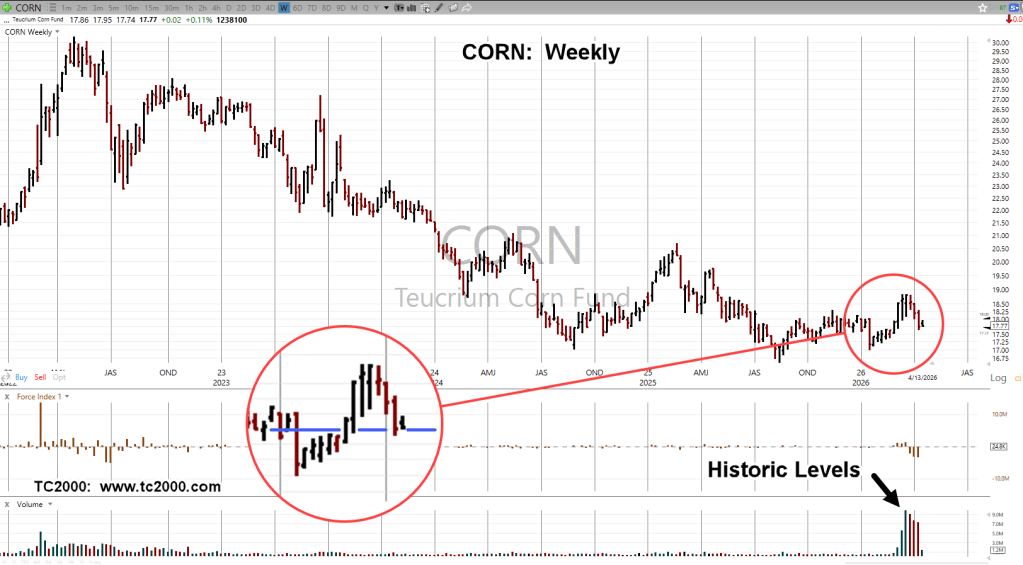
Trading in Teucrium Fund CORN, is at levels not seen in its history.
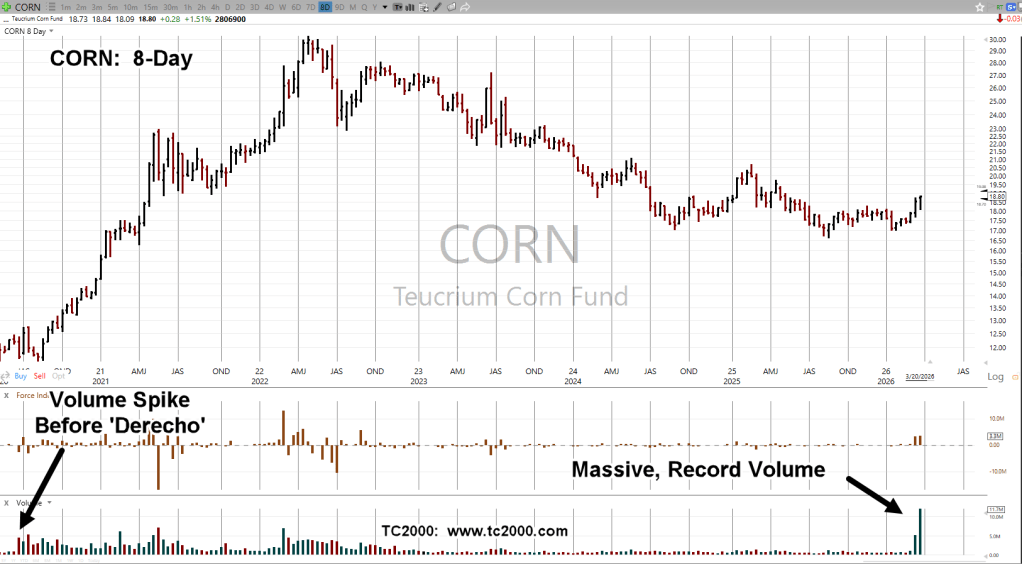
If we use the prior example of when there was an aberration in volume, there was a weather ‘event‘ six-to-eight weeks later (not advice, not a recommendation).
Note: Posts on this site are for education purposes only. They provide one firm’s insight on the markets. Not investment advice. See additional disclaimer here.
There’s massive volume in the Teucrium CORN, tracking fund.
The chart at left, is a Fibonacci 8-Day, with four more days to go before the current bar is complete.
The last time there was volume anywhere close to this, was back in June of 2020, several weeks before 10% of the U.S. corn crop was wiped out by an inland ‘hurricane’.
That incident launched a rally in CORN, lasting into the early part of 2022, gaining over 160% (not advice, not a recommendation).
Note: Posts on this site are for education purposes only. They provide one firm’s insight on the markets. Not investment advice. See additional disclaimer here.
Note: Posts on this site are for education purposes only. They provide one firm’s insight on the markets. Not investment advice. See additional disclaimer here.
CORN had been moving steadily higher for nearly two years.
Using Wyckoff and Fibonacci, the (potential) top and retrace was identified one week before it actually happened.
The last update on CORN, with chart analysis was here.
Fast forward to this post; commodities pivoted, and appear to be moving higher in relative unison.
So, what happens now?
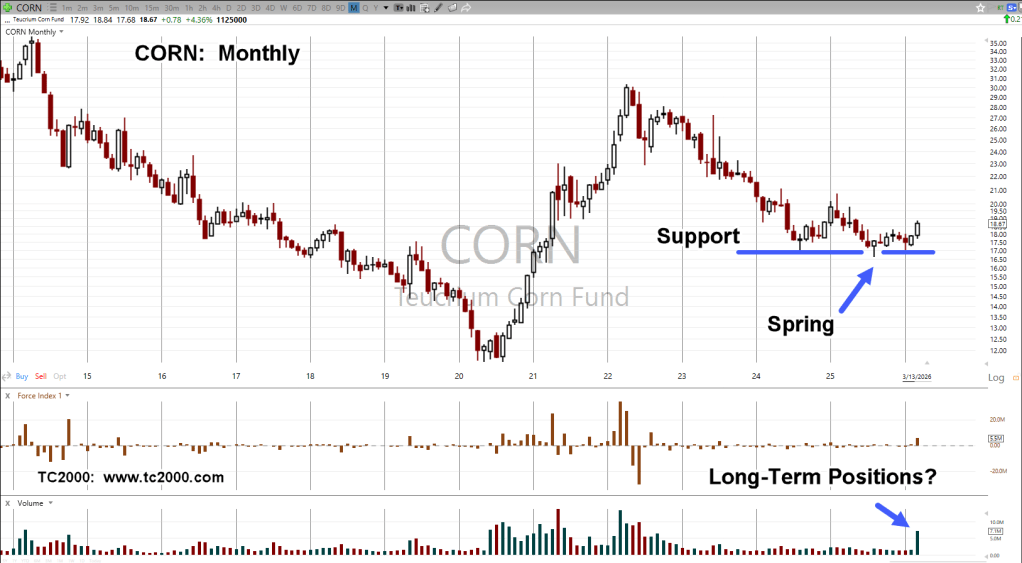
Teucrim Fund, CORN, Monthly
The ‘magenta’ arrow shows the location of the April post.
Moving on to the right-side, CORN held below support for seven months before pivoting higher.
If the labeling is correct, we have what looks to be a Wyckoff ‘spring’ set-up (not advice, not a recommendation).
That amount of time below support seems a bit of a stretch for labeling it as a ‘spring’.
Has that ever happened before?
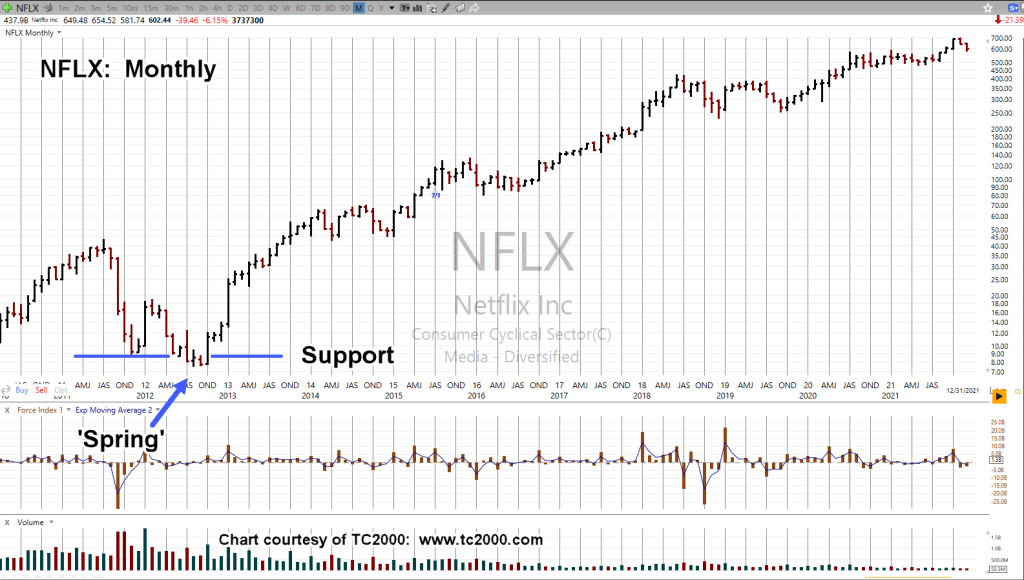
Case in point, Netflix
Netflix NFLX, Monthly
Depending on how it’s measured, back in 2012, NFLX, printed below support three-to-five months, before moving higher … in a big way.
With the chart of CORN, it’s unknown if we’ll get a ‘test’ of the breakout (purple oval).
At this point, there’s so much uncertainty in the financial markets as well as commodities, one needs to at least consider the possibility of a ‘test’.
Note: Posts on this site are for education purposes only. They provide one firm’s insight on the markets. Not investment advice. See additional disclaimer here.
Penetrating and holding just below support, we know what that means.
CORN is at The Danger Point®, in spring position (not advice, not a recommendation).
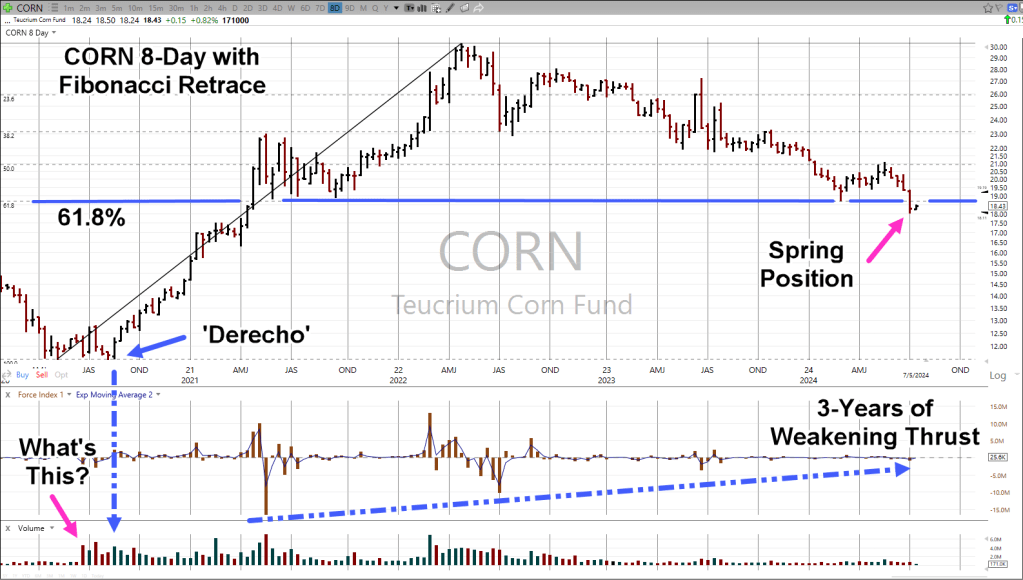
The chart below covers over four-years of price action; within that, we have at least three technical items to cover.
Somebody Always ‘Knows’
First, how does volume in CORN, go from basically nothing, to increasing over 400%, six weeks before, the perfectly timed and positioned (in the corn belt), ‘Derecho‘.
That location is identified as ‘What’s This?’
As Wyckoff said a century ago: ‘Somebody always knows something and that ‘something’ shows up on the tape’.
CORN Fibonacci, 8-Day
Second, is the successive decrease in downward thrust over the past three-years; at this point, nobody’s watching.
All of that brings us to the third technical point.
CORN has retraced to support (blue line) which just happens to be a Fibonacci 61.8%, level; penetrates that support and so far, has stopped dead.
Note: Posts on this site are for education purposes only. They provide one firm’s insight on the markets. Not investment advice. See additional disclaimer here.
Since Wyckoff analysis doesn’t care about the press, we’ll use it to discern the (potential) truth.
Let’s see how it did in the recent past. The Nat-Gas (UNG) low, was identified to-the-day,link here.
From that post, was this:
“Downward thrust in Nat-Gas UNG, appears to be exhausting itself after a 20-month, bear market.Risk is never zero, but currently appears to be at a low … “
So, it was. Afterwards, UNG bounced near, but never touched that low.
Twelve trading days later (Fibonacci 13 days, from low), it reversed decisively to the upside.
The Same, But Not
On the medium, to long-term, CORN action is the same as biotech (XBI), but opposite.
Instead of an up-thrust two-years in the making, we may have a spring set-up, taking just as long if not longer.
Note: Posts on this site are for education purposes only. They provide one firm’s insight on the markets. Not investment advice. See additional disclaimer here.
“What we’re looking for here, is some kind of Jimmy Carter type stunt where corn exports are halted in the name of ‘national security’ or some such thing.”
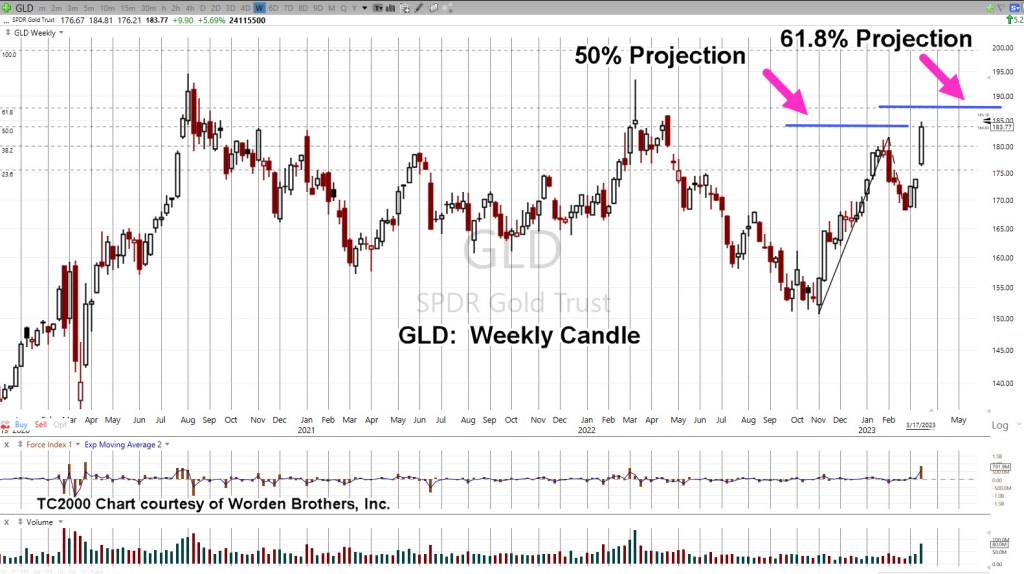
Corn Tracking Fund CORN, Weekly
Two Fibonacci projections are overlaid on the chart.
First, a simple retrace starting near ‘Derecho’ lows, to highs set during the week of April 29th, 2022.
Second, a counter-trend projection from those highs to the intermediate lows set during week of May 19th, 2023 and highs of June 23rd, week, the same year.
CORN has retraced 61.8%, which is also the 1:1 counter-trend projection. In addition, it’s the measured move from the wedge break.
The market has effectively confirmed the support area.
Oil Goes Negative … And Corn?
Remember that ‘anything can happen’. Oil futures made history by going negative.
We’re in a new construct, a new paradigm, our strategy should match accordingly.
Everyone has their own perspective and plan for the markets; fair enough.
From here, CORN could continue to new, all-time highs.
However, for my accounts, I’ll wait until such time it appears the downside risk is removed as much as possible.
One potential area for that ‘removal’ is the 76.4%, retrace in the vicinity of CORN @ 16 (not advice, not a recommendation).
Note: Posts on this site are for education purposes only. They provide one firm’s insight on the markets. Not investment advice. See additional disclaimer here.
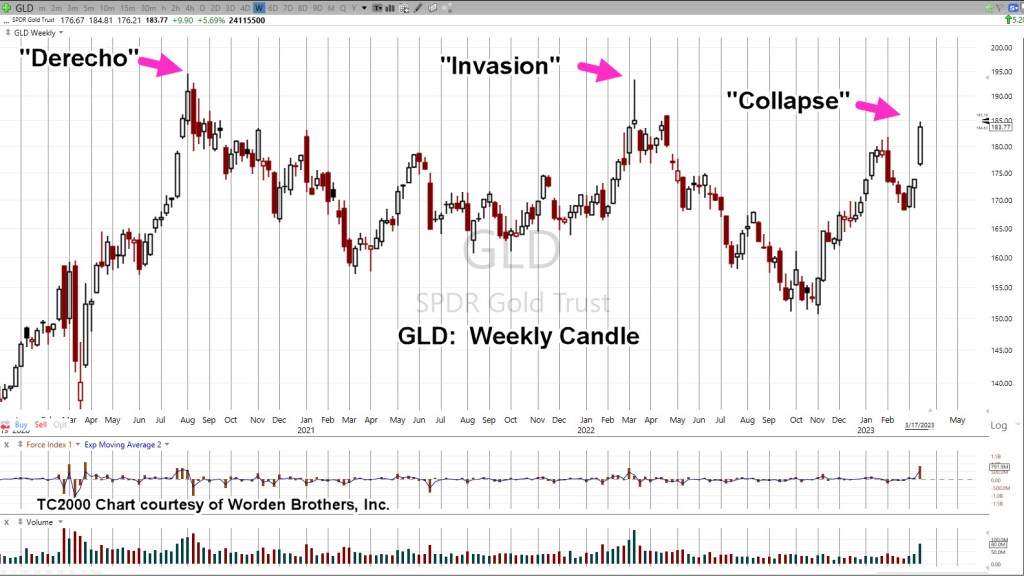
Gold’s reversal or potential for reversal, has already been covered here, here and here.
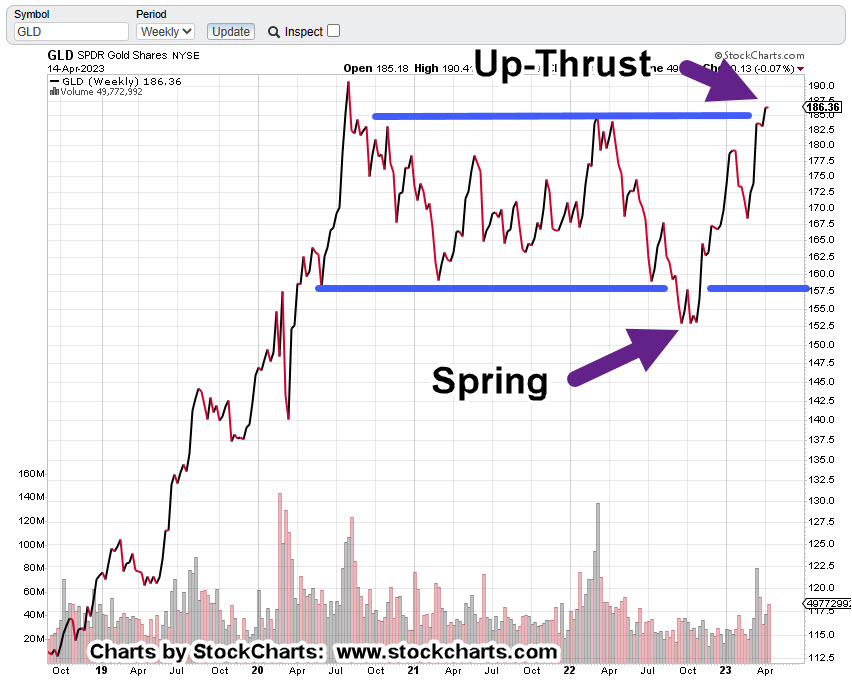
We’re going to focus on the Junior Miners GDXJ but start first, with an updated chart of gold (GLD).
Gold GLD, Weekly Close
This is how it looked back on April 15th.
As of the close yesterday, we have this:
It’s arguable GLD, is now below the resistance line (completing the Spring-to-Up-Thrust) but that’s not the most important part from a trading standpoint.
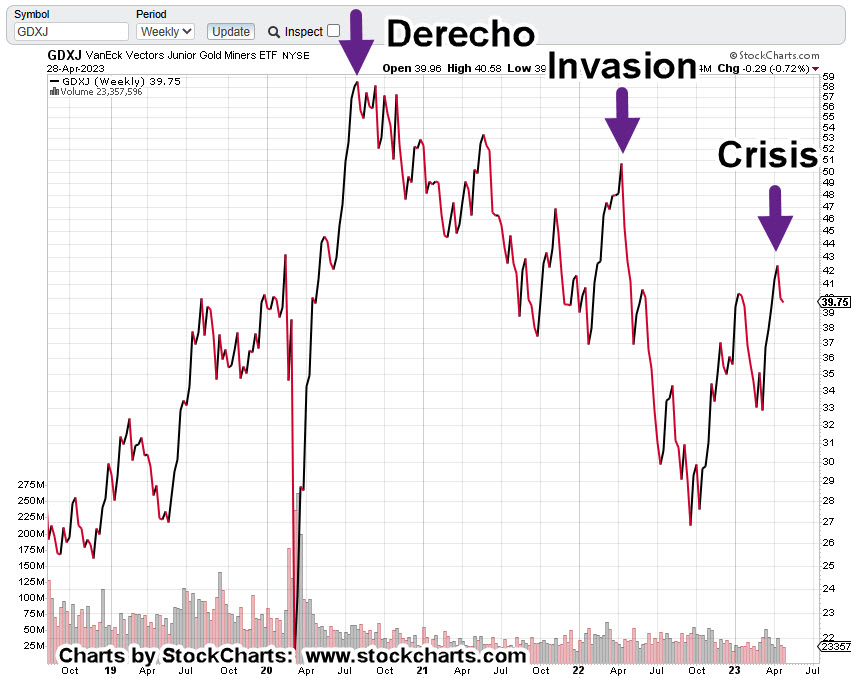
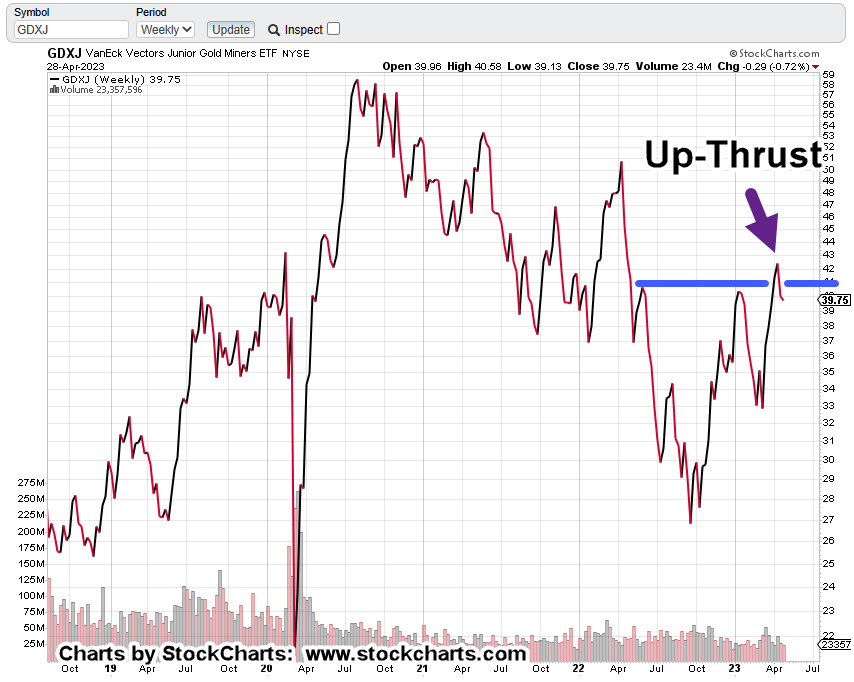
When looking at the Junior Mining Index GDXJ, there’s an ominous pattern.
Junior Miners GDXJ, Weekly Close
Each extreme peak over the last three-years has been labeled; the Derecho of 2020, the so-called Ukraine ‘invasion’, and now, the banking crisis.
Note: The SVB bank failure was on March 10th. There was a ‘knee-jerk’ reaction by the public into gold and related components … that peak appears to have stalled at the location shown.
What’s going on is obvious; it’s a bear market.
Each major peak, lower than the last.
Now, the interesting part.
The Junior Miners are in Wycoff Up-Thrust condition.
In this case, price action’s solidly below the resistance line.
Looking at the daily (not shown), there may have been a ‘test’ of resistance this past week for a move higher; if so, it failed and GDXJ closed slightly lower.
Summary & Positioning
So, here we are: The market (SPY) has rallied over the past week, giving the illusion that all is well.
However, it too is now in up-thrust (reversal) position.
For my business accounts, it looks like being short the miners at this juncture is lower risk than being short biotech (not advice, not a recommendation).
Typical short vehicles that could be used (not a recommendation) are DUST and JDST.
As always, anything can happen. If the markets ‘implode’, they might be closed for any number of days or weeks.
Note: Posts on this site are for education purposes only. They provide one firm’s insight on the markets. Not investment advice. See additional disclaimer here.
Note: Posts on this site are for education purposes only. They provide one firm’s insight on the markets. Not investment advice. See additional disclaimer here.
In chess, most (if not all) opens and responses have a name:
‘Danish Gambit’
‘Cochrane Gambit’
‘Petrov Defense’
‘Scotch Game’
‘King’s Gambit’
It’s been nearly one year, since discussing a potential corn trading strategy; during that time, the strategy remains in effect (not advice, not a recommendation).
We’re still waiting for a chess move from the ‘other side’.
Keeping in concert with traditional opening moves as named above, we’re going to name our set-up as follows:
‘Potato Head Gambit’
That is, an ‘administrative’ move which temporally puts the corn futures market into chaos. A move similar to Carter’s grain embargo of the 1980s.
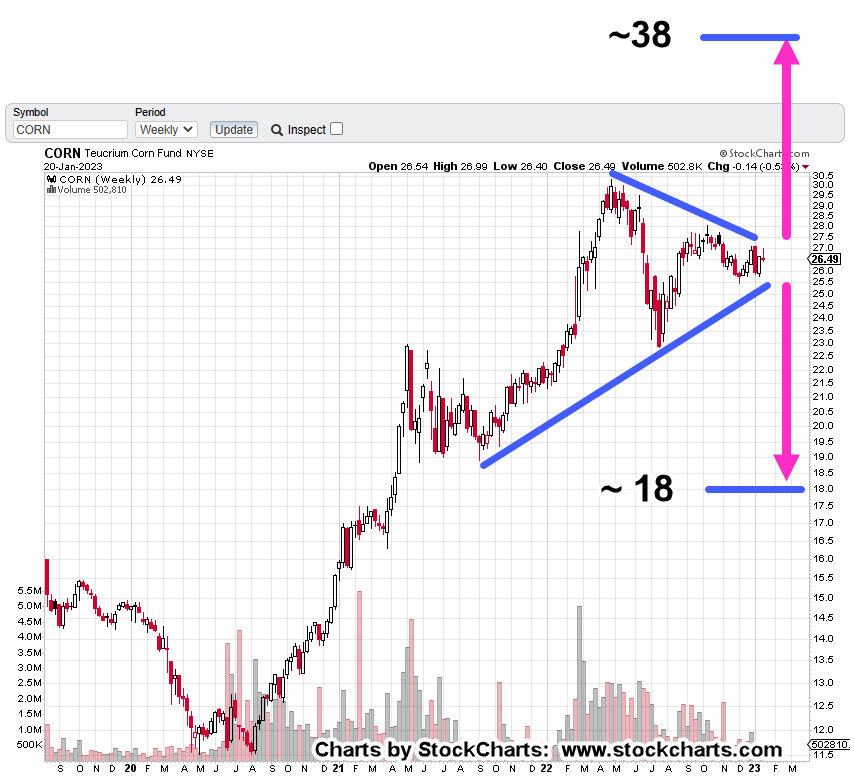
The weekly chart of tracking fund CORN, shows us something’s about to happen.
Either we get a breakout … or breakdown.
Teucrium Corn Fund, CORN, Weekly
The ‘Derecho‘ is marked as it was the kickoff to the current structure.
A wedge has formed.
A breakdown puts CORN, at a measured move in the vicinity of 18.0; a breakout to the upside, measures approximately to 38.0.
From a trading perspective, a breakdown is preferred.
Price action pushing lower to the 18-area, puts CORN below well established (support) lows of 2021.
A penetration of those lows would (potentially) put CORN in Wyckoff Spring Position.
Note: Posts on this site are for education purposes only. They provide one firm’s insight on the markets. Not investment advice. See additional disclaimer here.