Just over two-years ago, was this post, targeting CORN to bottom-out around the 16-level:
“However, shown on the chart is a potential low at the Fibonacci 76.4%, retrace.”
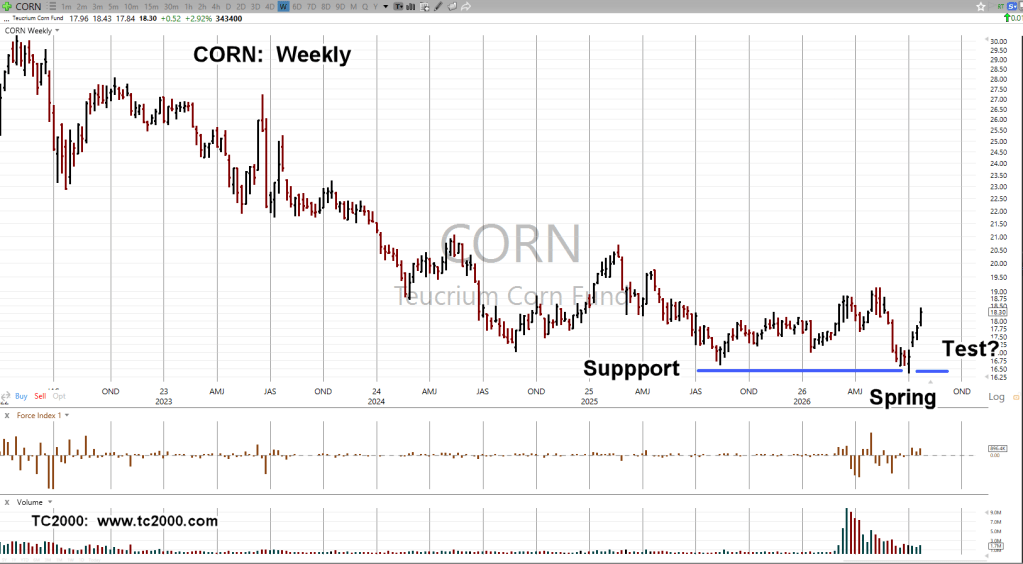
On June 30th, CORN hit an intraday low of 16.36, before reversing sharply to the upside.
Teucrium CORN, Weekly
As the chart shows, we’re in an apparent Wyckoff ‘spring’ condition; price action rising sharply after penetrating support (not advice, not a recommendation).
What we don’t have, is the ‘test’; there’s no way to say if there will be one.
However, the chart shows this coming week, is Fibonacci Week-5, from the lows.
Note: Posts on this site are for education purposes only. They provide one firm’s insight on the markets. Not investment advice. See additional disclaimer here.
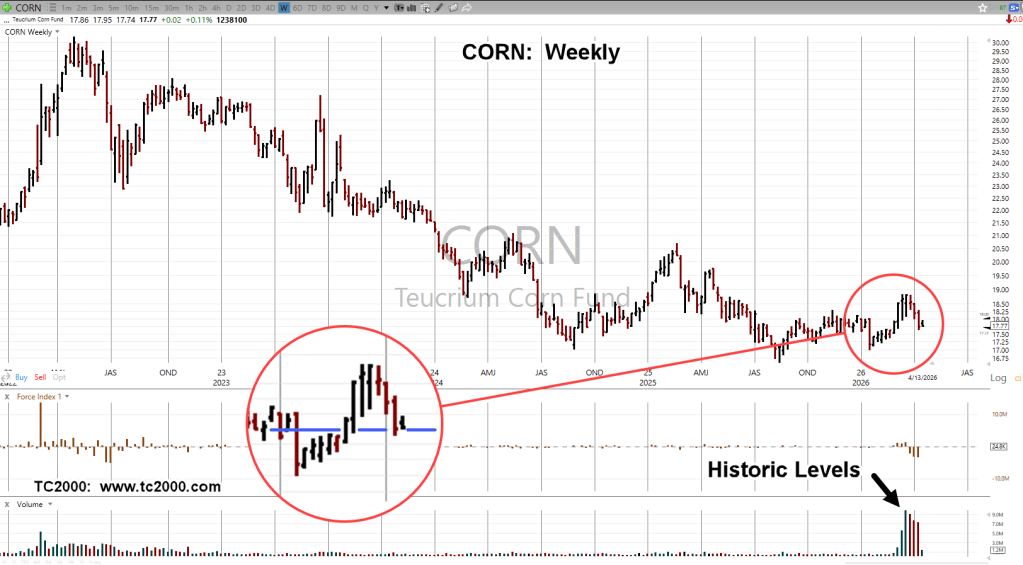
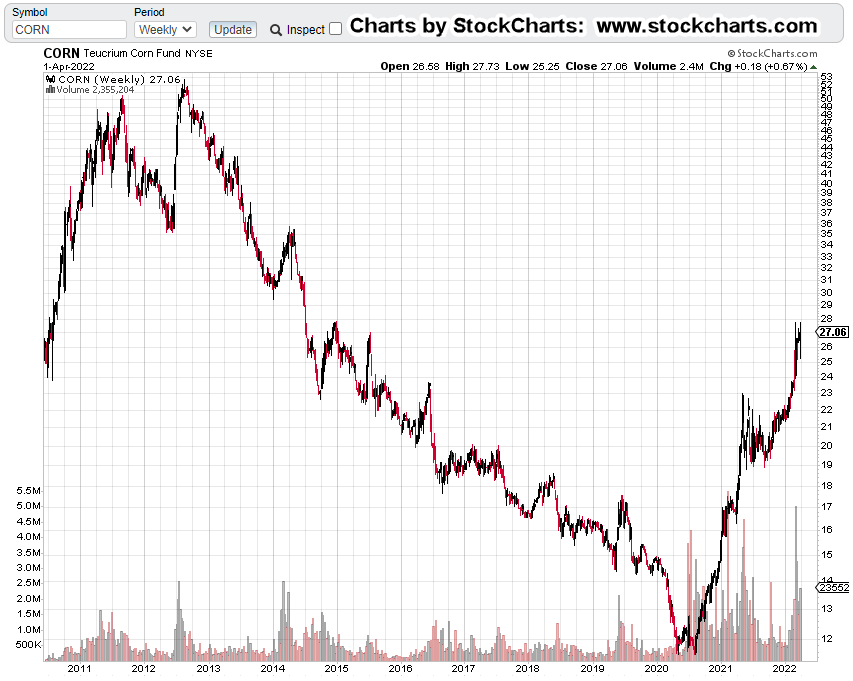
Trading in Teucrium Fund CORN, is at levels not seen in its history.
If we use the prior example of when there was an aberration in volume, there was a weather ‘event‘ six-to-eight weeks later (not advice, not a recommendation).
Note: Posts on this site are for education purposes only. They provide one firm’s insight on the markets. Not investment advice. See additional disclaimer here.
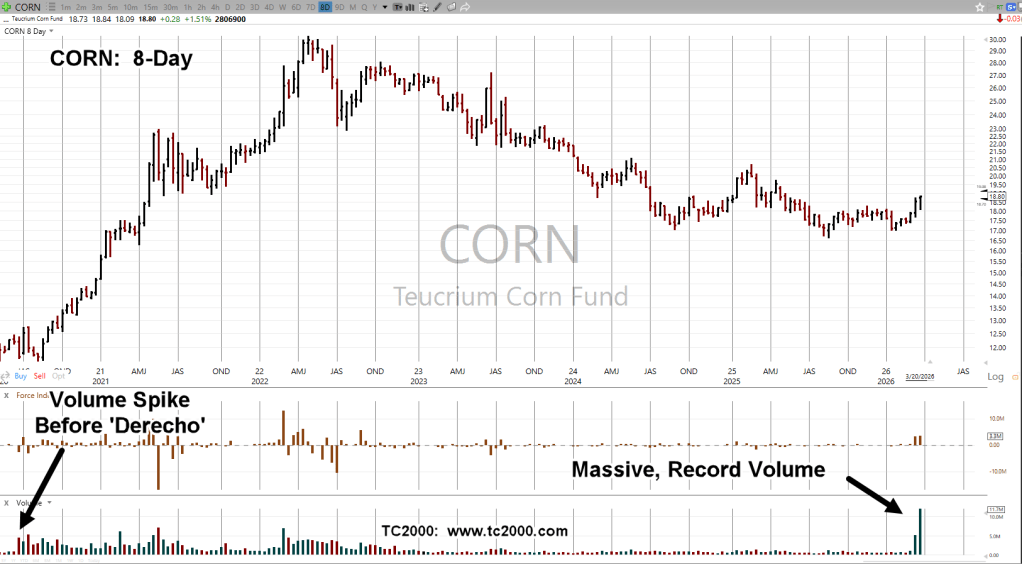
There’s massive volume in the Teucrium CORN, tracking fund.
The chart at left, is a Fibonacci 8-Day, with four more days to go before the current bar is complete.
The last time there was volume anywhere close to this, was back in June of 2020, several weeks before 10% of the U.S. corn crop was wiped out by an inland ‘hurricane’.
That incident launched a rally in CORN, lasting into the early part of 2022, gaining over 160% (not advice, not a recommendation).
Note: Posts on this site are for education purposes only. They provide one firm’s insight on the markets. Not investment advice. See additional disclaimer here.
Note: Posts on this site are for education purposes only. They provide one firm’s insight on the markets. Not investment advice. See additional disclaimer here.
CORN had been moving steadily higher for nearly two years.
Using Wyckoff and Fibonacci, the (potential) top and retrace was identified one week before it actually happened.
The last update on CORN, with chart analysis was here.
Fast forward to this post; commodities pivoted, and appear to be moving higher in relative unison.
So, what happens now?
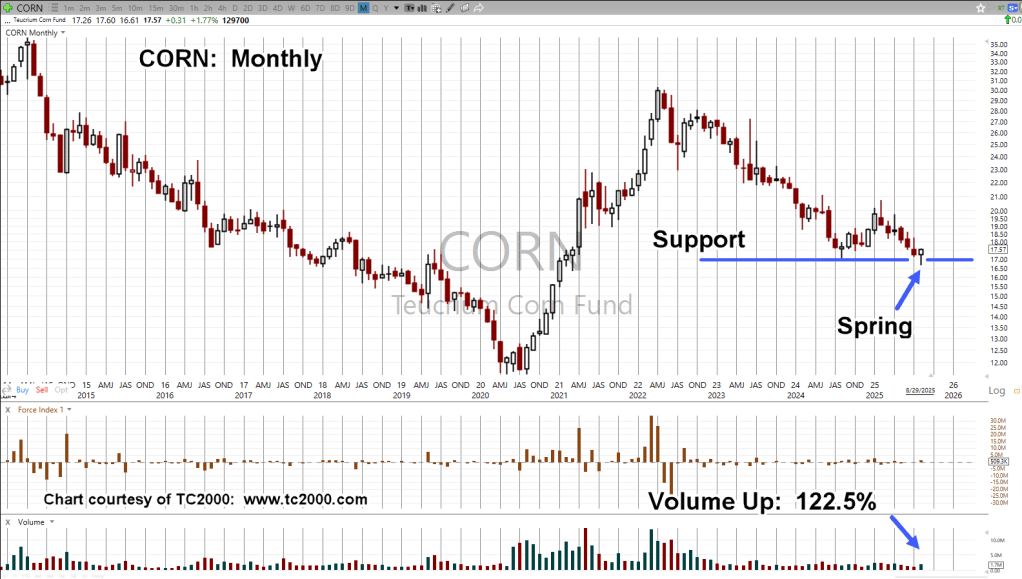
Teucrim Fund, CORN, Monthly
The ‘magenta’ arrow shows the location of the April post.
Moving on to the right-side, CORN held below support for seven months before pivoting higher.
If the labeling is correct, we have what looks to be a Wyckoff ‘spring’ set-up (not advice, not a recommendation).
That amount of time below support seems a bit of a stretch for labeling it as a ‘spring’.
Has that ever happened before?
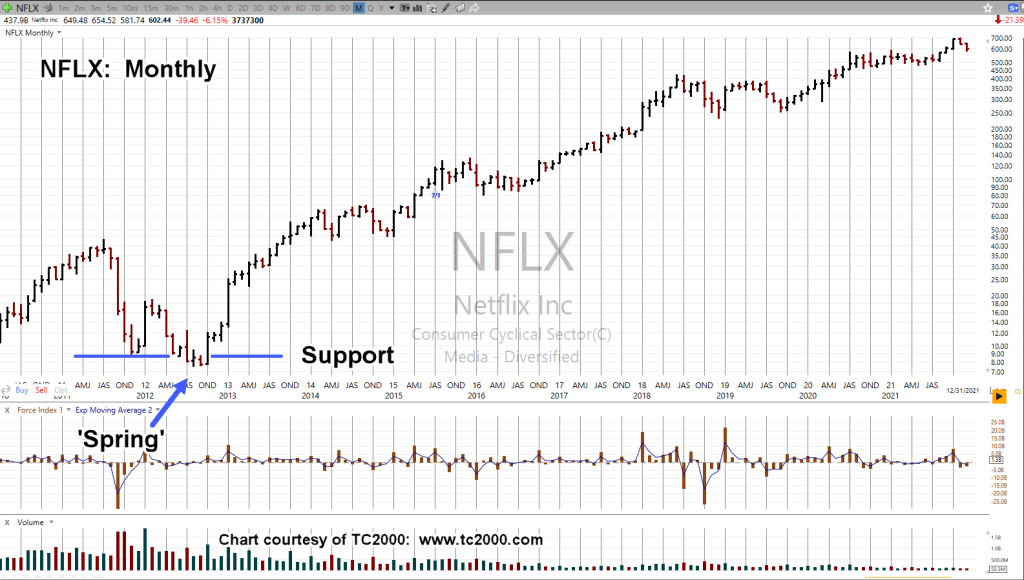
Case in point, Netflix
Netflix NFLX, Monthly
Depending on how it’s measured, back in 2012, NFLX, printed below support three-to-five months, before moving higher … in a big way.
With the chart of CORN, it’s unknown if we’ll get a ‘test’ of the breakout (purple oval).
At this point, there’s so much uncertainty in the financial markets as well as commodities, one needs to at least consider the possibility of a ‘test’.
Note: Posts on this site are for education purposes only. They provide one firm’s insight on the markets. Not investment advice. See additional disclaimer here.
Since Wyckoff analysis doesn’t care about the press, we’ll use it to discern the (potential) truth.
Let’s see how it did in the recent past. The Nat-Gas (UNG) low, was identified to-the-day,link here.
From that post, was this:
“Downward thrust in Nat-Gas UNG, appears to be exhausting itself after a 20-month, bear market.Risk is never zero, but currently appears to be at a low … “
So, it was. Afterwards, UNG bounced near, but never touched that low.
Twelve trading days later (Fibonacci 13 days, from low), it reversed decisively to the upside.
The Same, But Not
On the medium, to long-term, CORN action is the same as biotech (XBI), but opposite.
Instead of an up-thrust two-years in the making, we may have a spring set-up, taking just as long if not longer.
Note: Posts on this site are for education purposes only. They provide one firm’s insight on the markets. Not investment advice. See additional disclaimer here.
In chess, most (if not all) opens and responses have a name:
‘Danish Gambit’
‘Cochrane Gambit’
‘Petrov Defense’
‘Scotch Game’
‘King’s Gambit’
It’s been nearly one year, since discussing a potential corn trading strategy; during that time, the strategy remains in effect (not advice, not a recommendation).
We’re still waiting for a chess move from the ‘other side’.
Keeping in concert with traditional opening moves as named above, we’re going to name our set-up as follows:
‘Potato Head Gambit’
That is, an ‘administrative’ move which temporally puts the corn futures market into chaos. A move similar to Carter’s grain embargo of the 1980s.
The weekly chart of tracking fund CORN, shows us something’s about to happen.
Either we get a breakout … or breakdown.
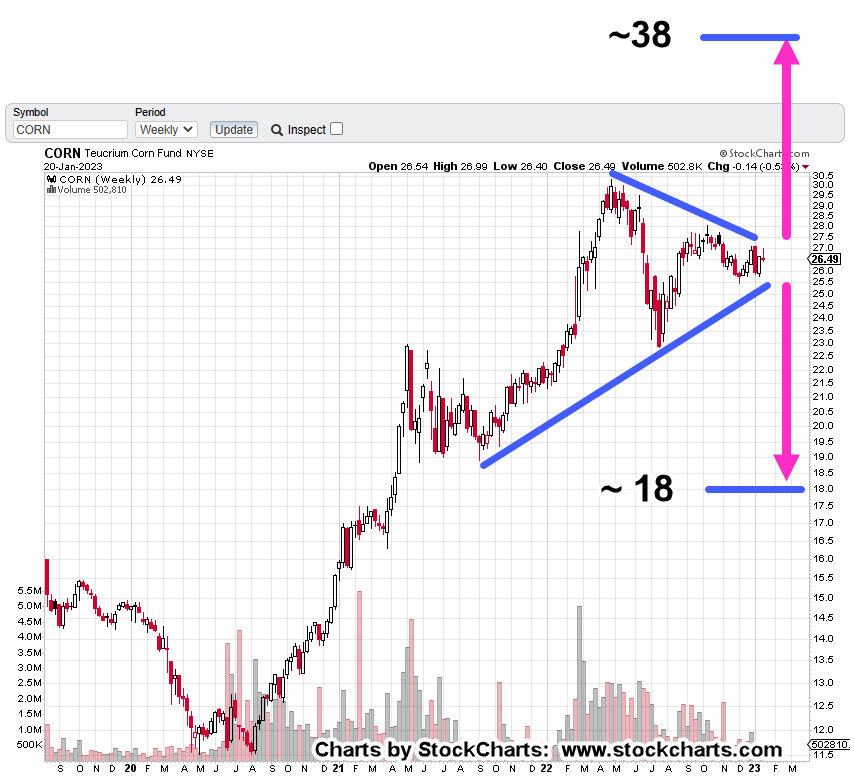
Teucrium Corn Fund, CORN, Weekly
The ‘Derecho‘ is marked as it was the kickoff to the current structure.
A wedge has formed.
A breakdown puts CORN, at a measured move in the vicinity of 18.0; a breakout to the upside, measures approximately to 38.0.
From a trading perspective, a breakdown is preferred.
Price action pushing lower to the 18-area, puts CORN below well established (support) lows of 2021.
A penetration of those lows would (potentially) put CORN in Wyckoff Spring Position.
Note: Posts on this site are for education purposes only. They provide one firm’s insight on the markets. Not investment advice. See additional disclaimer here.
That’s how one YouTuber described the Wyckoff method.
Well, judge for yourself.
The analysis in question is linked here and the video is here.
If you look at the video closely, the area called out as the ‘secondary test’ can also be identified as a ‘spring’ set-up.
Note how that spring goes straight into an up-thrust; the one being discussed at time stamp: 0:34.
Wyckoff analysis is both science and intuition.
The good part is discernment, the ability to intuitively perceive events, is a God-given gift.
By definition, no amount of Artificial Intelligence can fully replicate that ability.
Of course, that doesn’t mean the people J.P. Sears refers to at time stamp 3:26, won’t try.
So, let’s move on to the market at hand; corn and more specifically, Teucrium tracking fund CORN.
CORN, Weekly
From the week of the Derecho breakout to this past Friday’s close, is a Fibonacci 89-Weeks.
Friday’s weekly bar was also a reversal.
The week closed with the highest net negative volume since the week of October 15th, 2021.
Looking closer at the volume, we see the large spike during the week ended March 4th, followed by successive weeks of elevated volume.
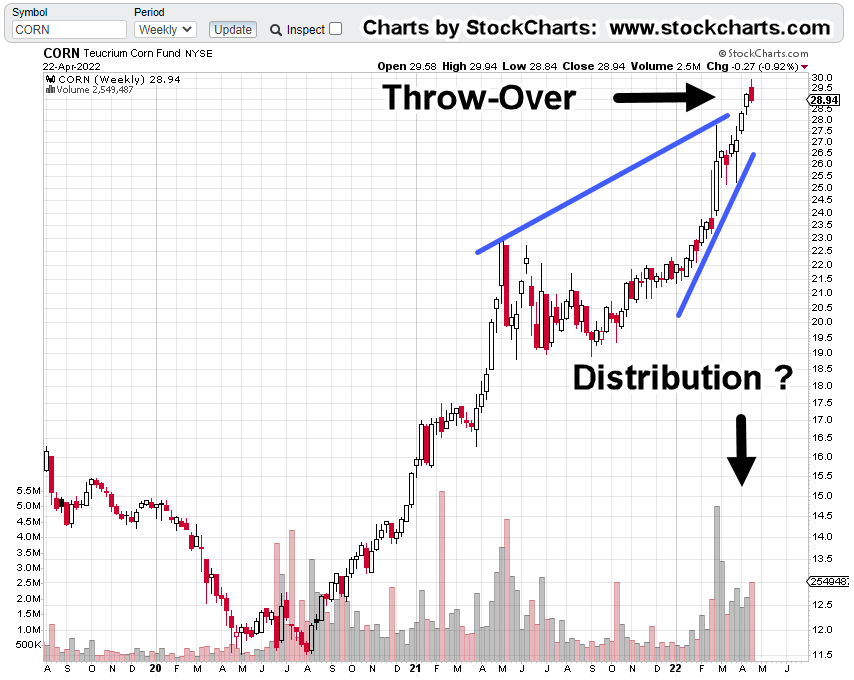
There’s also a terminating wedge with a potential throw-over; similar to what’s happening in Newmont Mining (NEM).
This market appears to be ripe for chaos.
Hitting The Mainstream
Adding to the probability for some kind of ‘event’, the price of corn is hitting the mainstream.
Throw in some real or fake news on food processing plants and the pressure for government to ‘do something’ continues to build.
Summary
The opportunity to go long CORN was way back at the Derecho.
At this point, prices are elevated to the point where risk appears to be increasing … potentially leading to a momentary price spike downward (not advice, not a recommendation).
If that happens, there’s likely to be chaos for several days as clearing firms either slow their payments, halt/cancel trades, or go bankrupt altogether … similar to what happened during the London Metal Exchange melt-down.
Note: Posts on this site are for education purposes only. They provide one firm’s insight on the markets. Not investment advice. See additional disclaimer here.
The food supply is, and is going to be destroyed; one way or another.
The latest in this ‘planned’ series of events, can be found here and here.
More information on the first link, is here. The initial paragraph says it all.
That second link calls the news a ‘Black Swan’ event.
Really?
It’s been known for years and reported by those who are brave (moving forward despite ridicule, threats, bank account closures), and who had insight, times like these were coming.
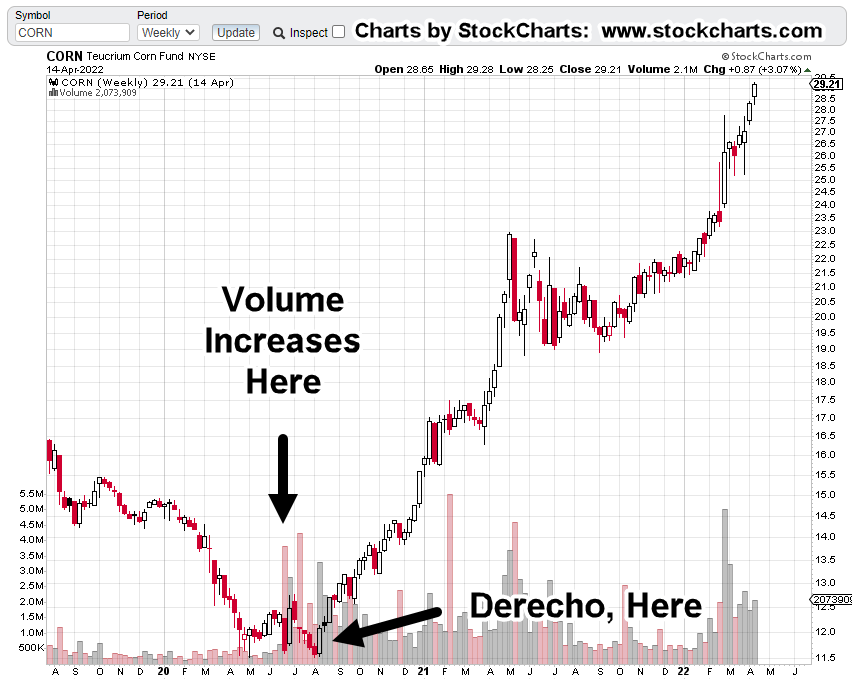
As a result, (i.e., since the Derecho) the commodities, specifically corn, have risen dramatically.
Teucrium tracking fund, CORN, Weekly
Looking and the chart, several items of note.
First: Volume picked up markedly in the fund, before the Derecho of 2020. Almost like someone knew something was about to happen … which it did.
Wyckoff said it best a century ago … those in the know, will have their actions show up on the tape.
Second: We’re currently in Fibonacci Month 21, since the Derecho. Does that mean we’ll have another market event?
Let’s see how the fertilizer news affects the futures market at the next open.
However, more specifically as posted in this update, we’re looking for some type of ‘administration’ announcement that temporally crashes the price of corn.
Third: Getting back to the chart of CORN, the right side is showing signs of potential distribution.
We’ve had the largest weekly volume, ever, during the week of March 4th.
After that, volume has remained elevated … a possible changing of hands and distribution.
Summary
Markets like to test wide high-volume print areas. There’s always a potential for that type of test in any market.
For CORN above, the high-volume area is around 23.00 – 23.50; an approximate drop of -21%, from current levels.
If we get some type of ‘export restriction’ announcement, a (temporary) 20-plus percent drop in CORN, is not unreasonable.
Note: Posts on this site are for education purposes only. They provide one firm’s insight on the markets. Not investment advice. See additional disclaimer here.
Note: Posts on this site are for education purposes only. They provide one firm’s insight on the markets. Not investment advice. See additional disclaimer here.