Facts & Fibonacci
On July 31st, Apple had its largest single day thrust (energy) lower since late 2020.
Since then, it’s been a Fibonacci 21-Days to now, this past Friday.
As the chart shows, a bearish wedge has been formed, giving the appearance AAPL may be near the end of its corrective move.
Fundamentals
For those interested in fundamentals, APPL’s current valuation(s), we can thank our ‘commenter’ at this link. It’s an interesting read.
Apple AAPL, Daily
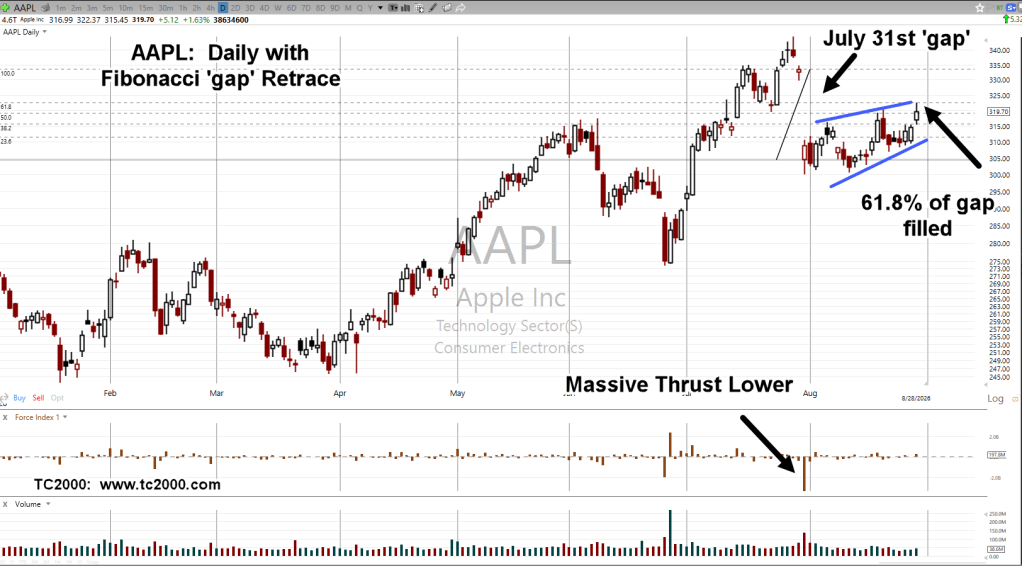
If AAPL posts a new daily low at the next session, the bearish wedge may be complete (not advice, not a recommendation).
Stay Tuned
Charts by StockCharts
Note: Posts on this site are for education purposes only. They provide one firm’s insight on the markets. Not investment advice. See additional disclaimer here.
The Danger Point®, trade mark: No. 6,505,279


Thanks for the mention.
Lately I’ve been digging around into Felix Zulauf’s stuff. I don’t know if you like him, but I personally think his approach works. He looks at short and long term cycles in the market. He seems to think the market will top out between Q3 2026 (about now) and Q4 of 2027 and the ensuing correction will be between 30-50%. Pretty wild stuff. But I remember him calling for a bull run in gold in late 2022 and early 2023 so it’s hard to ignore him.
The Benner cycle also points to a high in 2026.
LikeLiked by 1 person
Thanks for your input.
I’ve watched a couple of Zulauf’s video-shorts a while ago and I have even seen his chart of ‘bubble concentration’ on someone else’s video … can’t remember who.
So, the same information seems to be getting passed around or used by others.
The market turn, whenever it comes could be a slow, multi-month topping affair like the S&P in 2000, literally taking forever to roll over. Or it could be a straight down crash (and bonce) like the Nasdaq during the same time-period.
I was really into cycles before my mentoring with Daivd Weis but pretty much abandoned that analysis after those sessions (which lasted about three months).
From then on, it’s been total focus on price action or to quote Weis … “What’s the market saying about itself”.
The latest example is AAPL.
You have already done the work on the fundamentals, and I used that link in the latest update. Thank you. The gist of the article was this multi-decade iPhone show is probably over and over for a very long time (not advice).
With that said, the latest update on APPL presents that if it posts a new daily low tomorrow, then we have probability in favor of a sustained ‘correction’ or outright decline from here on.
Supporting that is the fact that other cyclicals like AZO for example just can’t seem to get it together and close its massive gap. The “Sellers Exhausted” update was correct to the exact day. AZO rallied for three days immediately after but then fell apart.
More and more for AZO, that big gap now looks like a ‘breakaway’.
From an APPL perspective, are we about to see if its own gap is a breakaway or will it somehow claw its way back up.
Market opens in about nine-hours. 🙂
Thanks again,
Paul
LikeLiked by 1 person