Strategy, Tactics, Focus

Just over two-years ago, was this post, targeting CORN to bottom-out around the 16-level:
“However, shown on the chart is a potential low at the Fibonacci 76.4%, retrace.”
On June 30th, CORN hit an intraday low of 16.36, before reversing sharply to the upside.
Teucrium CORN, Weekly
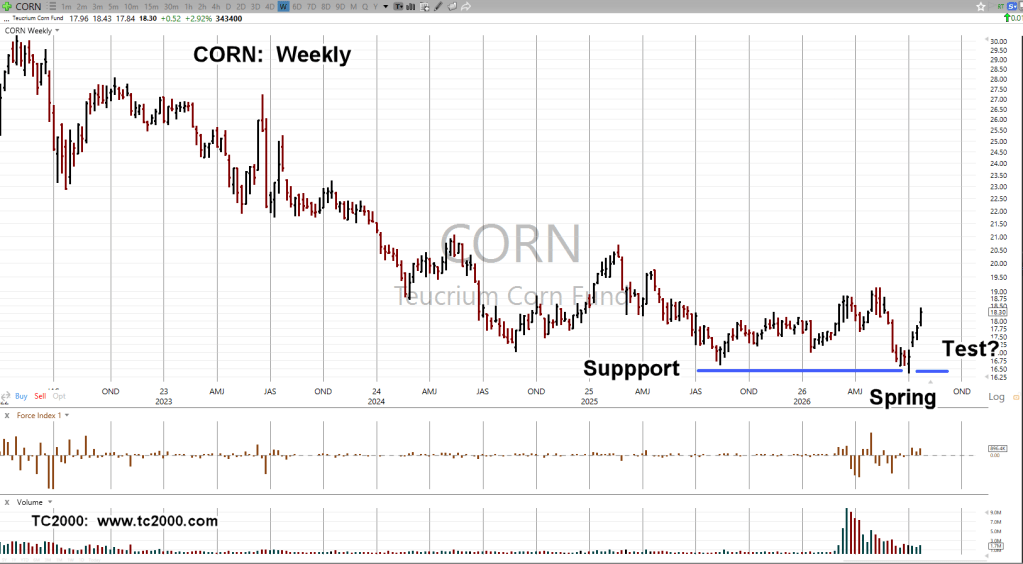
As the chart shows, we’re in an apparent Wyckoff ‘spring’ condition; price action rising sharply after penetrating support (not advice, not a recommendation).
What we don’t have, is the ‘test’; there’s no way to say if there will be one.
However, the chart shows this coming week, is Fibonacci Week-5, from the lows.
Stay Tuned
Charts by StockCharts
Note: Posts on this site are for education purposes only. They provide one firm’s insight on the markets. Not investment advice. See additional disclaimer here.
The Danger Point®, trade mark: No. 6,505,279


I could see Corn taking a breather here.
I read this article on a german website called The Market and it’s been on my mind a lot lately; it lays out a bear case for Apple.
https://themarket.ch/makro-maerkte/thierry-borgeat-zu-big-tech-was-haben-sie-sich-nur-gedacht-ld.16990
LikeLike
I read the link, thank you.
I think it was Dr. Van Tharp that said (paraphrasing), ‘You don’t trade the market. You trade your beliefs about the market.’
Talking to any number of market participants will prove that point. Some will focus on what the Fed is going to do. Others, think ‘fundamentals’ decide the action and on it goes.
During mentoring sessions with the late David Weis, when I would send him anything related to fundamental analysis, he completely ignored my messages. Never a reply.
However, when I discovered things like (at the time) mini-silver futures contracts were pivoting at Fibonacci 233-contract intervals, he was quite interested.
It’s literally taken decades (for me) to come out of the belief that fundamentals (or any other financial metric) move the market. Wyckoff himself discovered this truth way back in 1902.
It’s my opinion, the fundamentals, the price-to-sales numbers and so on, are a ‘happenstance’ to the actual data. The price action itself.
With that said, AAPL may indeed reverse from here or reverse soon. I can’t say.
However, when it does reverse, the market itself may let us know well in advance the reversal is nigh.
Thanks again,
Paul
LikeLiked by 1 person