Exhibit ‘A’
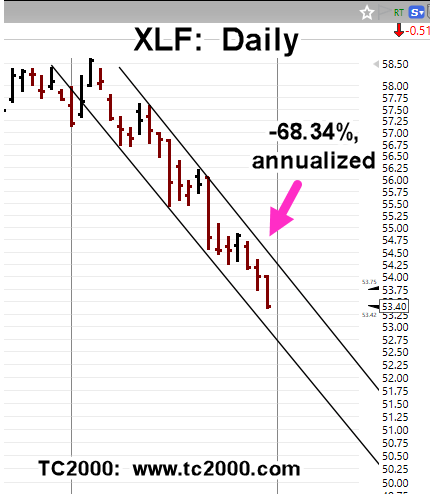
A ‘reverse trendline’ is a technique (described by Weis in 2007), where the left-most trend is plotted first, then copied and moved to the right to contact price action.
That was done for XLF.
One might think the channel was drawn just before this post.
In actuality, trendlines were drawn about eight trading days ago.
Stay Tuned
Charts by StockCharts, TC2000
Note: Posts on this site are for education purposes only. They provide one firm’s insight on the markets. Not investment advice. See additional disclaimer here.
The Danger Point®, trade mark: No. 6,505,279


I’ve always thought your trend channels were kinda strange but now that you explain it, I see that you’re using a technique. I’ll have to google David Weis and check him out.
I’m guessing he attempts to create channels ahead of the price action. Which is interesting because channels are usually drawn after the fact. But this makes most channels a lagging indicator. And once the market recognizes a pattern, it usually ceases to be a pattern anymore.
LikeLike
Thanks for the honest assessment.
The David Weis website has been shut down, but the video I’m referencing is still (at this point) available from Dr. Elder, who sponsored the conference where it was recorded.
Link here: Weis Video
It’s well worth the $100 and in particular the analysis of the Apache Oil (APA) spring set-up is an absolute treatise on the Wyckoff method.
Bottom line: Weis was a genius. I was privileged to have been mentored by him.
Of course, I paid him big bucks. 🙂
With that said, there seem to be channels everywhere in the market. Home Depot and Lowes are two that come to mind.
Today’s post is out soon. It will be on volume indicators in the LABD leveraged inverse (biotech) fund.
Regards,
Paul
LikeLiked by 1 person