Testing The Test

Yesterday’s update showed how Airbnb tested its wide, high-volume breakout with its own wide, high-volume downside.
That move culminated on September 23rd, which in turn, set up a test of those high-volume bars.
All of this action brings us to now.
The chart below, is a 2-Day Close of ABNB, going back to late 2021.
Airbnb ABNB, 2-Day Close
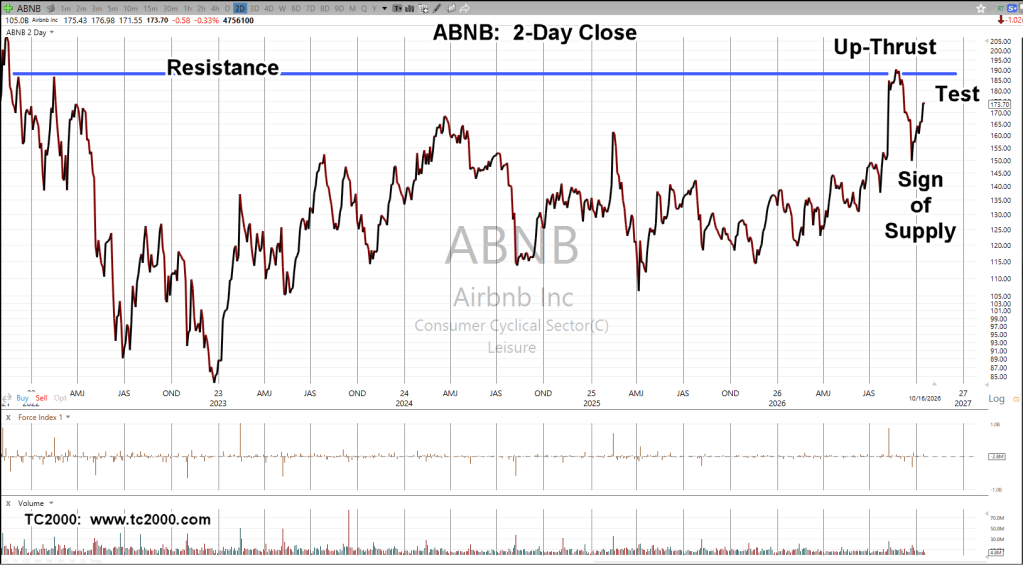
At the right side, we’re using Wyckoff terminology of ‘Up-Thrust’, ‘Sign of Supply’ and ‘Test’.
The up-thrust action penetrated long standing resistance at the far left. Then, reversed lower with what can be called ‘ease of movement’.
Now, we’ve come back up to test the up-thrust area.
Going Nowhere, Fast
It’s true that ABNB has oscillated in a wide range that’s over 100% from lows to highs.
However, there’s been no sustained long-term breakout to the upside.
With that said, ABNB has been posting (since 2020) sideways action.
In Wall St. parlance, a sideways market, is a bear market (not advice, not a recommendation).
Stay Tuned
Charts by StockCharts, TC2000
Note: Posts on this site are for education purposes only. They provide one firm’s insight on the markets. Not investment advice. See additional disclaimer here.
The Danger Point®, trade mark: No. 6,505,279

