What Happened, Last Time?

The last time we had a major (sustained) economic melt-down, was 2007 – 2008.
The market (S&P) bottomed on March 9th, 2009, posting a low at 666.79.
During that collapse, Hartford Financial was one of the hardest hit.
It imploded, crashed, by -96.87%.
It’s important to note, HIG bottomed at 3.33, during the week-ending, 3/6/09; you can’t make this stuff up. 🙂
So, let’s take a look at what HIG, is doing now and if it’s at risk, yet again (not advice, not a recommendation).
We’re looking at the long-term, the Quarterly Chart
Hartford Financial, HIG, Quarterly
With just a few weeks left in the Quarter, HIG is positing a reversal.
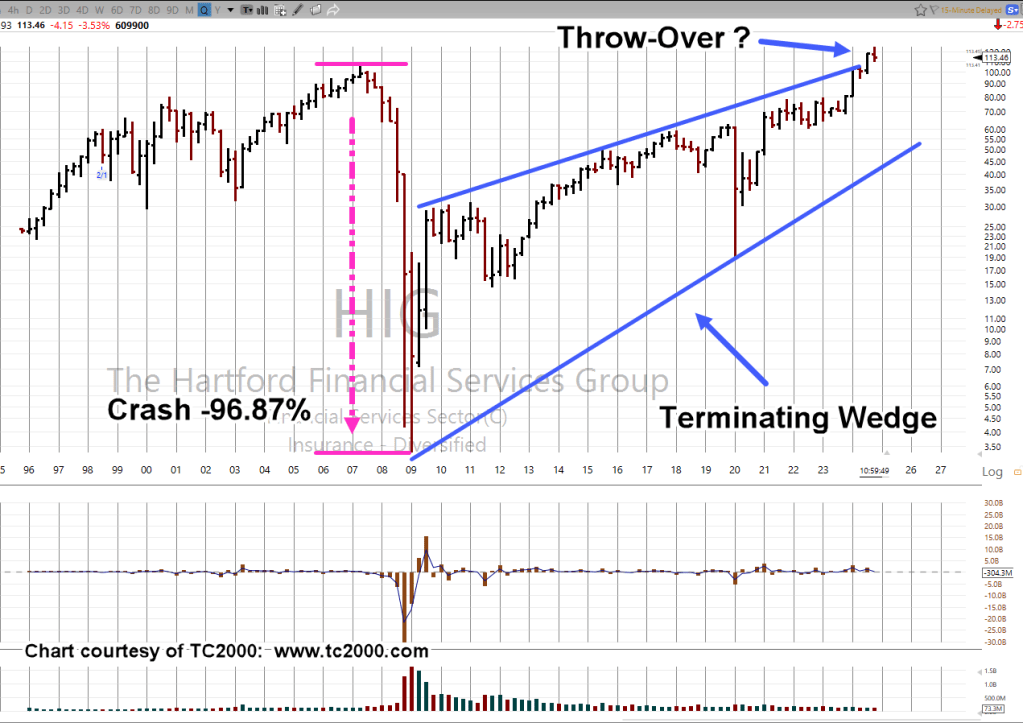
From a classical analysis standpoint, a reversal back into the wedge (and then upside test) would be a potential sell-signal (not advice, not a recommendation).
Stay Tuned
Charts by StockCharts
Note: Posts on this site are for education purposes only. They provide one firm’s insight on the markets. Not investment advice. See additional disclaimer here.
The Danger Point®, trade mark: No. 6,505,279
