Once Again, The Pattern Repeats
It’s been one (potentially) false breakout after another.
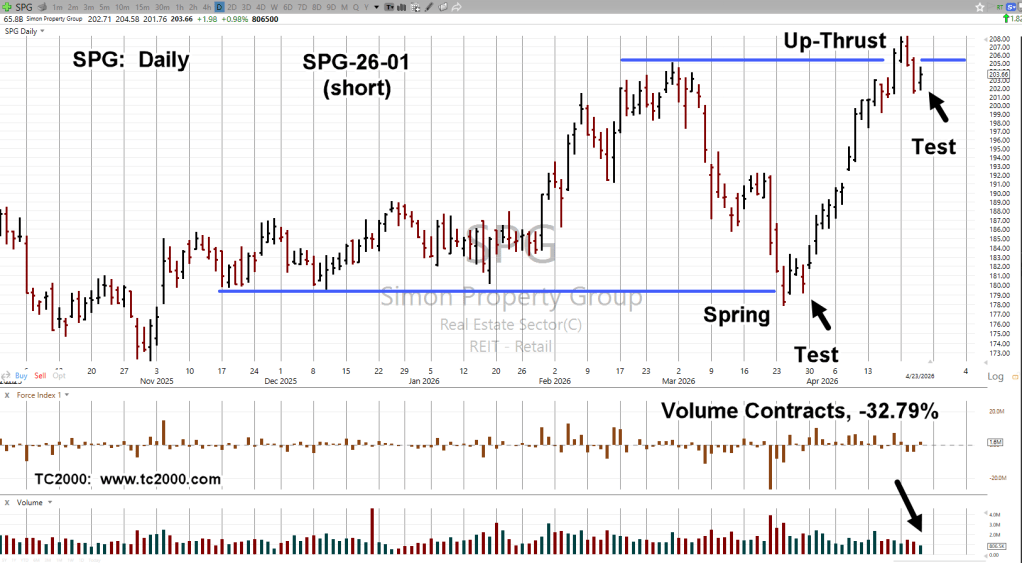
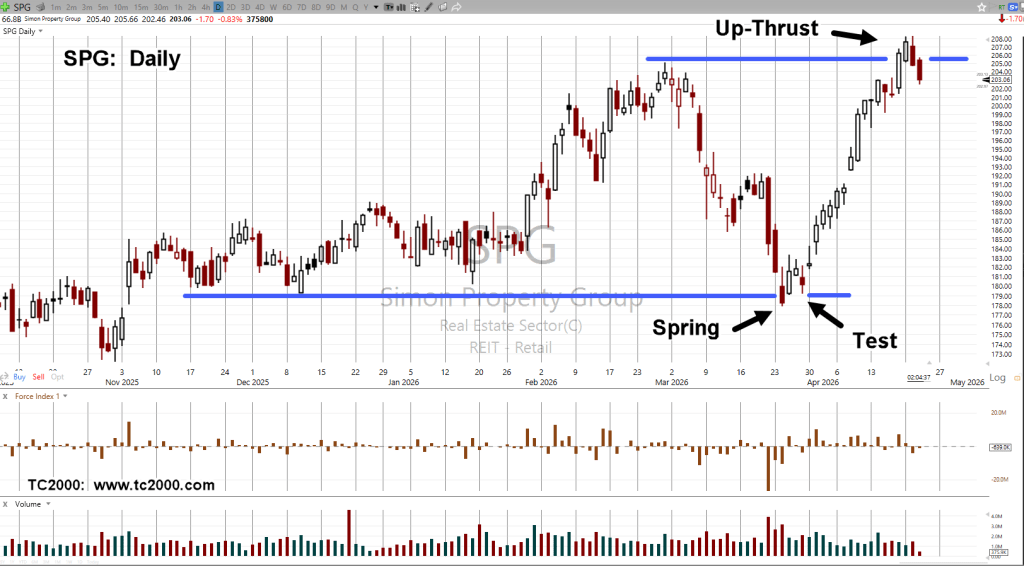
So far, we have Alcoa, Simon Property Group, and now, Five Below.
Before continuing, trade AA-26-03, Alcoa short. closed: Profit 2.51% (not advice, not a recommendation).
The expectation was for decisive downside; it wasn’t happening
Now, back to FIVE.
The longer-term chart shows what’s taking place in this market and the markets overall, is on a massive scale.
Five Below FIVE, Weekly
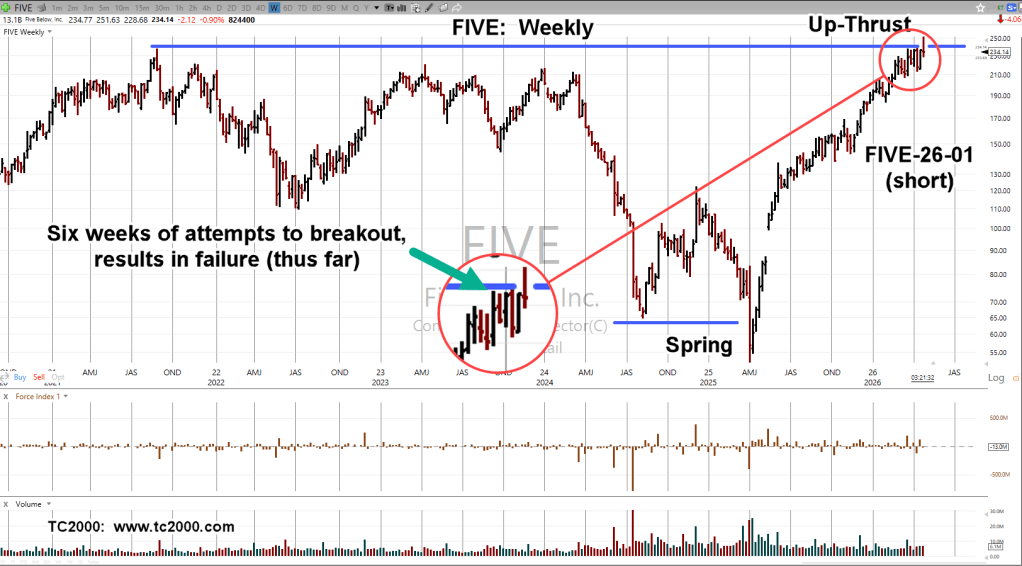
The zoom area has five weeks of tight congestion.
That was followed by an attempted upside breakout last week, which (so far) has failed.
The stop on short-trade FIVE-26-01, is set at just above Friday’s high, 239.52 (not advice, not a recommendation).
Stay Tuned
Charts by StockCharts
Note: Posts on this site are for education purposes only. They provide one firm’s insight on the markets. Not investment advice. See additional disclaimer here.
The Danger Point®, trade mark: No. 6,505,279