Note: Posts on this site are for education purposes only. They provide one firm’s insight on the markets. Not investment advice. See additional disclaimer here.
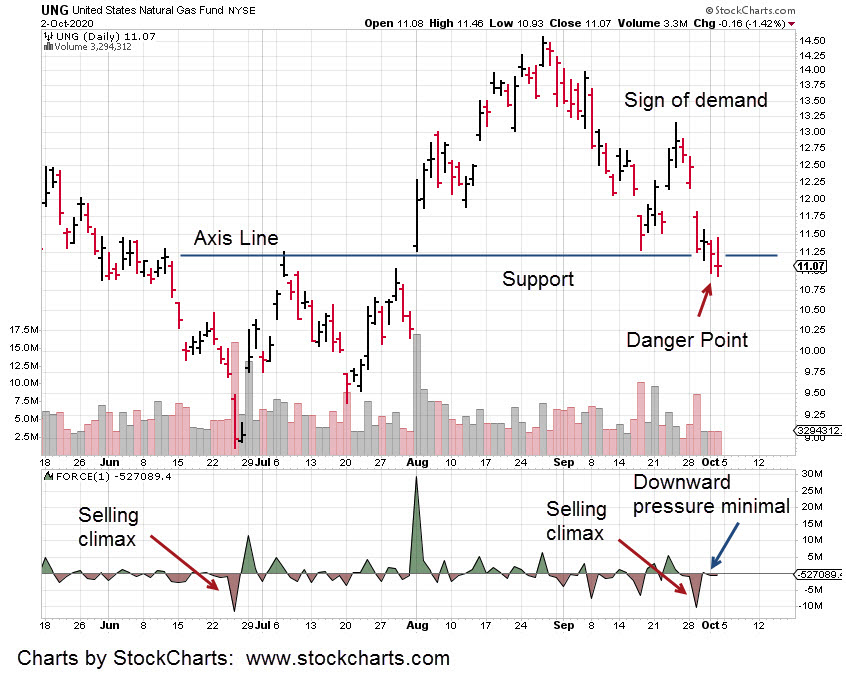
At this juncture, downward pressure on nat-gas (UNG) has evaporated.
At pivots, this price action scenario is nearly always the case.
Way back a century ago, the father of technical analysis, Wyckoff said it best; ‘It’s as if the weight of a feather could move the market in either direction.’
This location was dubbed by his acquaintance, Livermore, as the ‘danger point’.
It’s the point of least risk; Where the margin (gain or loss) of being right or wrong is narrow and easy to see.
Note: Posts on this site are for education purposes only. They provide one firm’s insight on the markets. Not investment advice. See additional disclaimer here.
All of this is happening at the same time. The source at this link does an excellent job of monitoring earthquakes and associated phenomena.
These two links, here and here are good source for weather extremes and crop failures.
Unanticipated weather extremes could launch nat-gas, UNG to levels atypical for a seasonal (winter) position.
One well placed earthquake fracturing gas distribution lines, could do the same.
Typical nat-gas move:
A seasonal nat-gas move, starts around late September, early October and tops out just before December.
The possibility of weather extremes could push that top out into January or February … completely unexpected.
Price action is the key. So far, it’s moving off the danger point to slightly higher levels. We’ve opened a sizeable position and will follow the price action on up with a stop as needed.
Depending on how that action behaves, the current stop level (not advice, not a recommendation) is tentatively set close to yesterday’s low: UNG 10.98
Note: Posts on this site are for education purposes only. They provide one firm’s insight on the markets. Not investment advice. See additional disclaimer here.
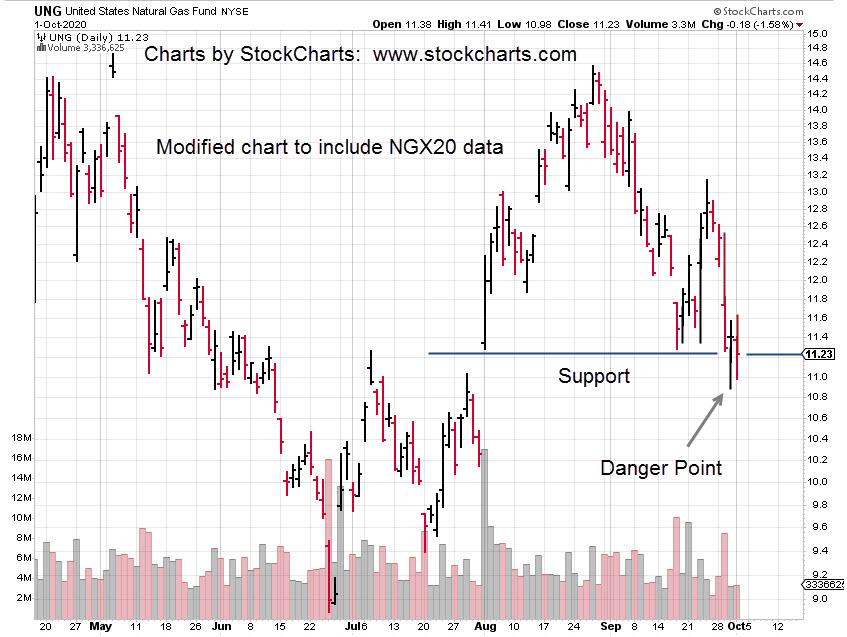
Natural gas trades as a futures contract nearly 24/7. Therefore, the daily chart of UNG is misleading.
Not shown on the standard UNG chart is the most recent low.
That low, in the futures market was right around 7:30 a.m EST on Wednesday, September 31st.
By looking at a chart of UNG, one would think the low for nat-gas occurred today. Not so.
We’ve modified the UNG chart below to represent recent price action on the November contract (NGX20), not shown on UNG.
The low from yesterday’s action is clear. Also clear is today failed to penetrate that low even though a new daily low appears on the unaltered chart of UNG.
In all, it means were at the danger point for natural gas.
Note: Posts on this site are for education purposes only. They provide one firm’s insight on the markets. Not investment advice. See additional disclaimer here.
Note: Posts on this site are for education purposes only. They provide one firm’s insight on the markets. Not investment advice. See additional disclaimer here.
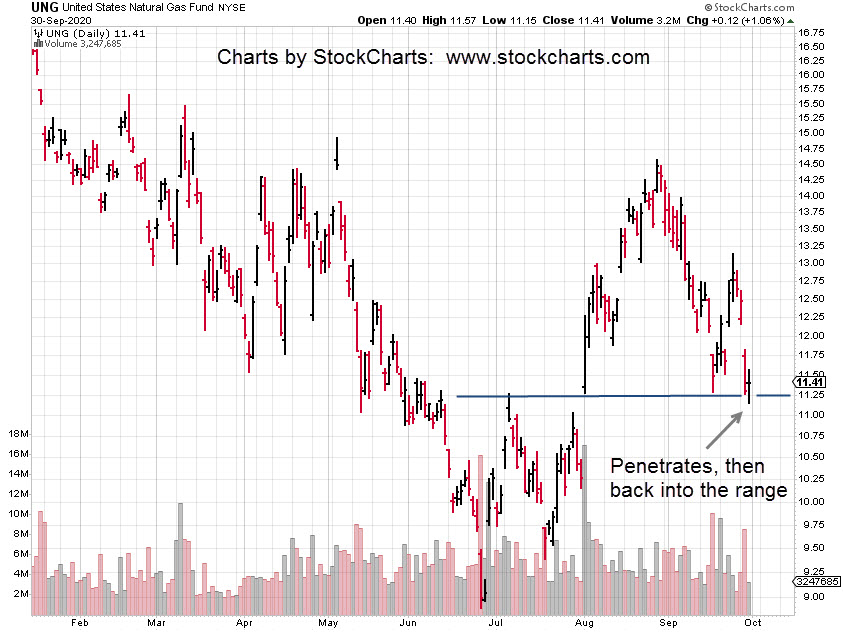
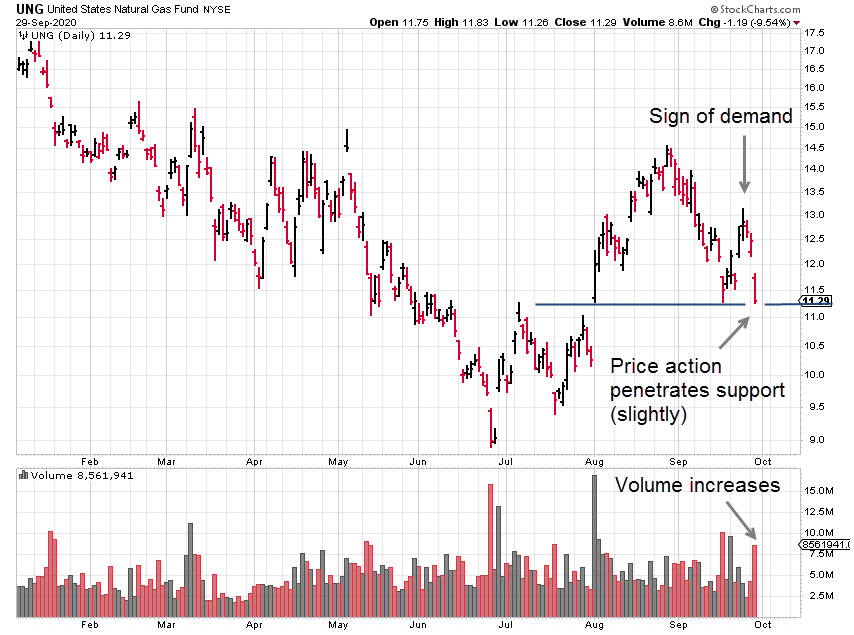
The 61.8%, retrace level (from the June low to the August top) for UNG is around the 11.04, area.
If UNG continues lower in the next session and does not make significant headway (down), it may have found a bottom ahead of the report.
Note that price action can get volatile for a few minutes after the release.
Nat-gas is similar to silver in that regard … stop run attempts (and spikes) are the norm.
We’ve already come off a long term low during June this year. Now, we have seen a recent Sign Of Demand (using a Wyckoff term) during the past week … it all suggests bias to the upside.
Note: Posts on this site are for education purposes only. They provide one firm’s insight on the markets. Not investment advice. See additional disclaimer here.
Note: Posts on this site are for education purposes only. They provide one firm’s insight on the markets. Not investment advice. See additional disclaimer here.
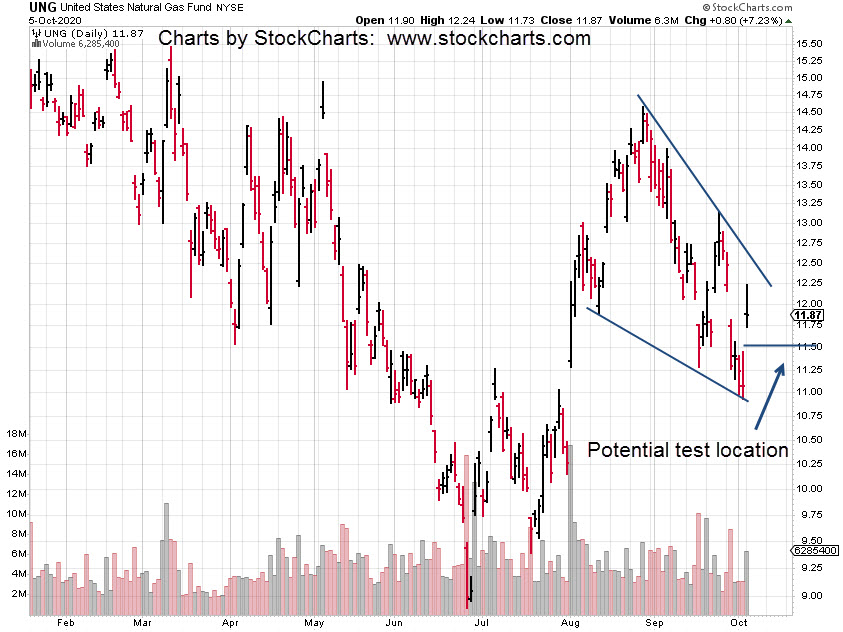
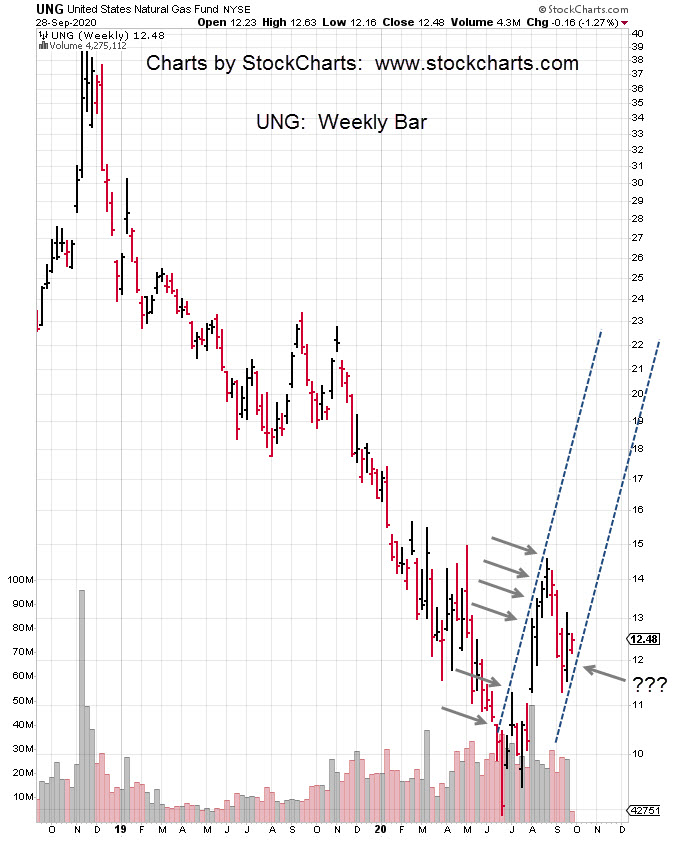
Natural gas and more specifically, the tracking fund UNG is at its trend line; A trend line that’s been in-effect since July 31st, this year.
The Winter of Discontent post on natural gas, indicated a major long-term reversal. That analysis was complete with a test location (shown on the chart below).
It’s important to note, the test level was identified thirteen (trading) days in advance.
There was plenty of time to monitor price action, perform additional research and generate a supporting case before the test zone was reached.
UNG subsequently tested that level and never looked back.
Now, UNG has penetrated support (at the 13.00-area) and contacted its July trend line at the same time.
Essentially, in Wyckoff terms, it’s in spring position with the added technical condition of being at trend. For more on Wyckoff “springs”, see this publication.
This exact point is the ‘danger point’.
If UNG does not immediately bounce higher (at the next session), the trend may be broken and we’re right back into a possible continuation of the bear market that’s been in effect for years.
It should be noted that ‘danger points’ are also the location of lowest risk. Verification or failure of the move is not far away in either market direction.
Note: Posts on this site are for education purposes only. They provide one firm’s insight on the markets. Not investment advice. See additional disclaimer here.