The Russell 2000 (IWM) puts it into perspective.
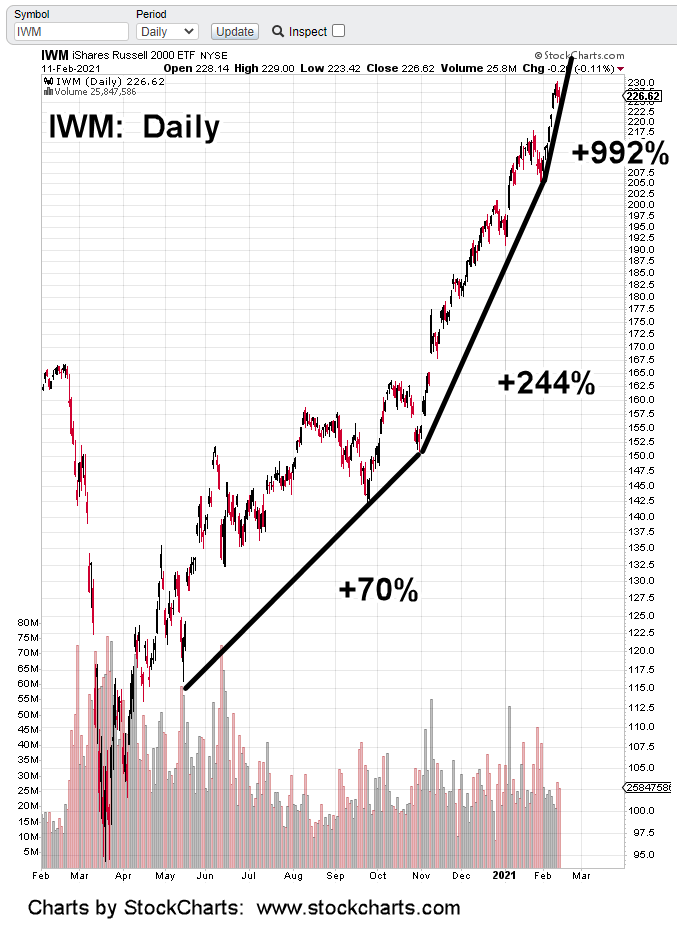
Trending higher at nearly 1,000% annualized, it’s obvious a break is coming.
Exactly how or when of course, is not known.
However, it has been proposed by this site (for years), when the final bubble-break comes, it’s likely to be an over-the-weekend event that results in a severe gap down open.
A gap down of say, 20% – 50%.
Can’t happen? After the events of 2020, we should all know that anything can happen.
Theoretically, a gap down of -25% from current levels, puts IWM right at long-time support around ~170.
Under such conditions when a severe disconnect is possible, one approach is to prepare on the short side (not advice, not a recommendation).
Using Wyckoff analysis techniques (for bear markets), that means to look for sectors not participating in the mania. When the downdraft hits, those markets will (potentially) move lower farther and faster.
That brings us to real estate, IYR
Using the same time-scale and trend line notations, we get the chart below:

From a purely visual perspective, the struggle to move higher is obvious. The past two sessions have made no net progress.
Looking more closely at recent action, IYR is following a Fibonacci time sequence.

From the low on January 12th, to the most recent high on Wednesday the 10th, is a Fibonacci 21 days.
The added bonus is the inflection point on Day 13.
Bid/Ask spreads on inverse fund DRV, in the pre-market are not that reliable; at this juncture, 8:10 a.m., EST) they indicate a higher open.
Stay Tuned
Charts by StockCharts
