
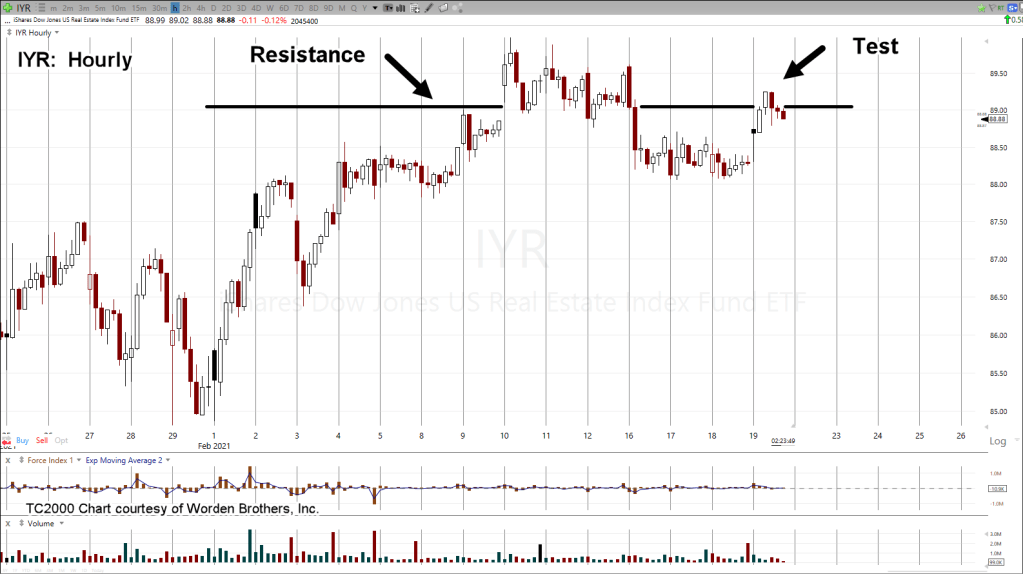
It’s about an hour before the close and real estate, IYR is struggling to reman above resistance.
Two charts are provided in this update. Weekly and hourly.
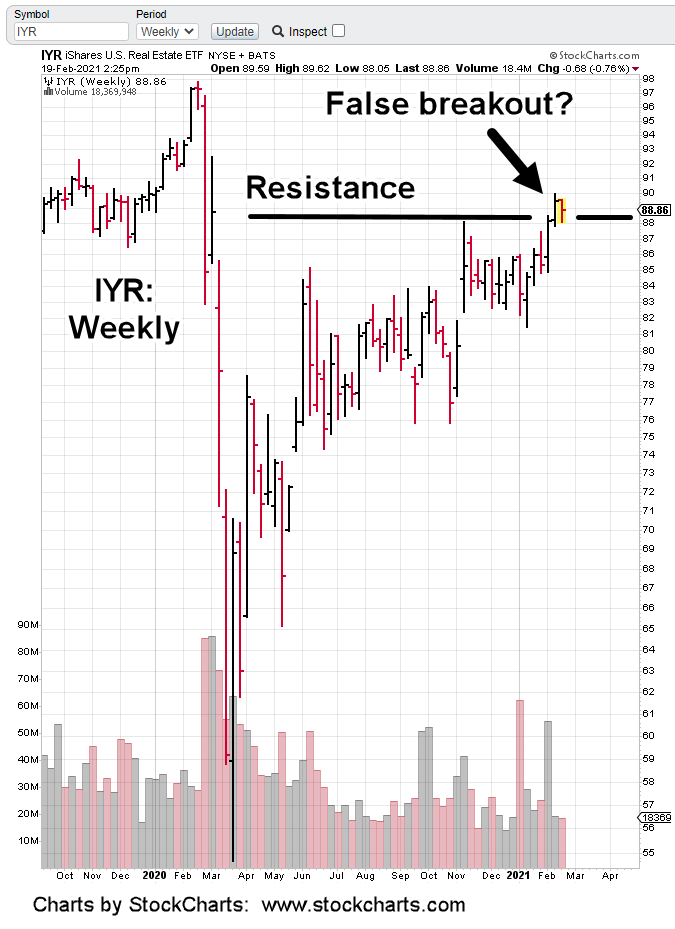
The big picture is the weekly.
Resistance at 88 – 90, level is clear.
The second chart is the hourly.
Price action on the hourly can be seen posting above resistance for about three trading days. Then, it reversed lower this past Tuesday, the 16th.
The largest cap in this ETF, AMT remains in its own down trend.
Today, it attempted to move higher but that higher level (around 229.50) could not hold.
At this juncture, AMT (chart not sown) is trading lower near 228-level.
AMT has been discussed previously. Most recent update at this link.
Summary:
Real estate, IYR is testing the attempted breakout higher during today’s session. So far, that test is not able to hold; indicating weakness.
In addition, last week’s up-volume contracted by -65% over the prior (breakout) week.
There is apparently no (or very little) support at these levels.
Market Positioning (not advice, not a recommendation)
I have maintained my firm’s position short this sector via DRV, the 3X inverse of IYR.
If IYR can’t get significantly above resistance during this session, the long awaited IYR top and reversal may be at hand.
Charts below:
Hourly chart of IYR
Charts by StockCharts
