5:29 p.m., EST. Updates in red
1:32 p.m., EST
It looks bad on the Weekly;
Even worse, on the Quarterly
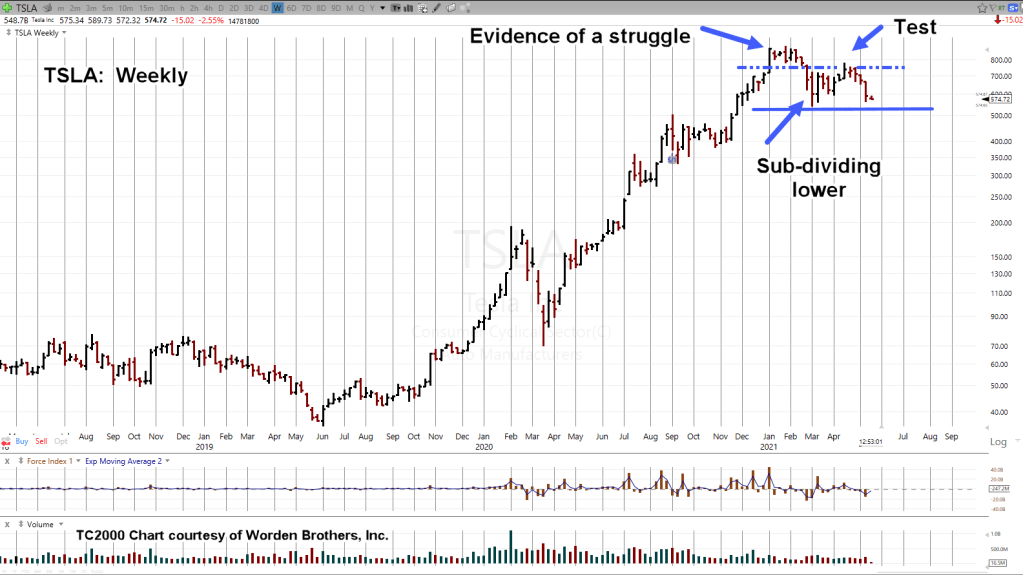
Early this year, TSLA spent about seven weeks attempting to move significantly higher.
During the week of February 26th, it gave up and broke down.
Since then, its come up to test the underside of support … now resistance (around 740) before again, turning lower.
Down -37%, since the end of January sounds bad enough. However, it’s the quarterly chart that contains the real horror story.
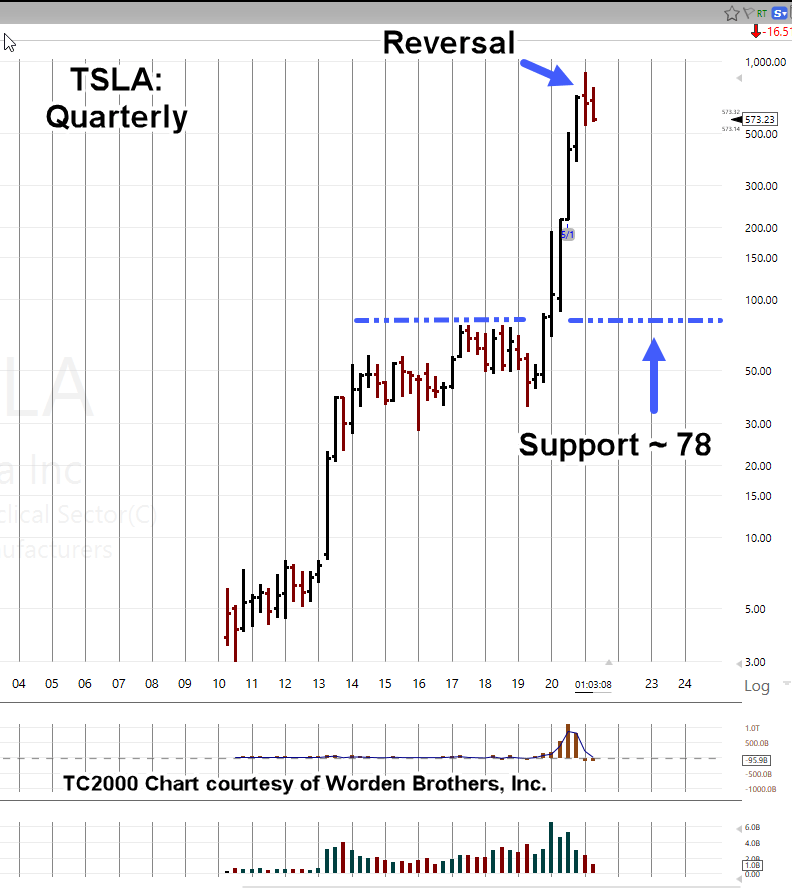
TSLA has posted a huge 490-point trading range (when taken from support at 78, to current price).
A down move to support from today’s levels, is a decline of -86%.
Markets like to come back and test; better to count on it, than ignore it.
Not saying that will happen to TSLA.
Nearly simultaneous with this first post, we have this article on ZeroHedge about a huge short position.
However, if any real problem does come up like another high profile ‘incident’ (as if we don’t have enough of them already), meaningful support is a long way down.
Just a few hours later, we have this, also from ZeroHedge about a Tesla running over two police officers … in China no less.
