9:12 a.m., EST
Trend Break Last Friday
Underside Test, In-Process
End Of The Line?
It’s about twenty minutes before the open. SPY, is trading essentially flat.
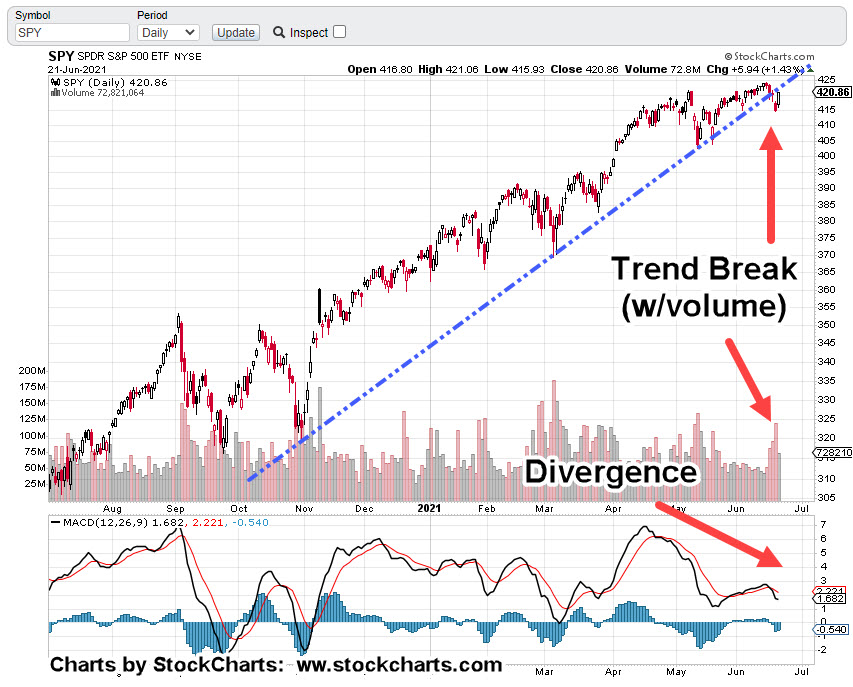
The daily chart above, shows the up-trend break was last Friday on increased volume.
SPY, has also posted a bearish divergence appearing to show significant weakness; attributed to MACD lines and histogram declining in parallel.
Getting a closer look (below):
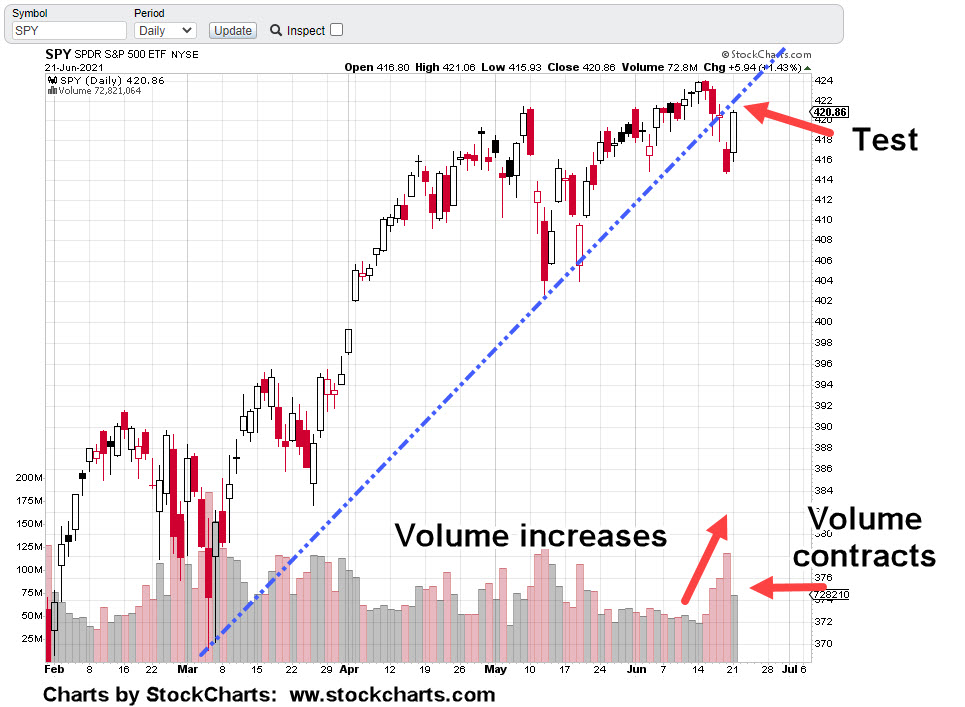
Volume increases on the way down and decreases on the way up: Bearish
We also have a terminating wedge:

Yesterday was a test of the underside trend break. Today may continue that test or reverse at the open.
If SPY can somehow get above the trend break, it has a new lease on life.
However, with bonds, the dollar and gold already in reversals, probabilities suggest we’re at the end of the line.
Stay Tuned
Charts by StockCharts
Note: Posts on this site are for education purposes only. They provide one firm’s insight on the markets. Not investment advice. See additional disclaimer here.
