8:07 a.m, EST
Trending @ 5,000,000 %, Annualized !!!
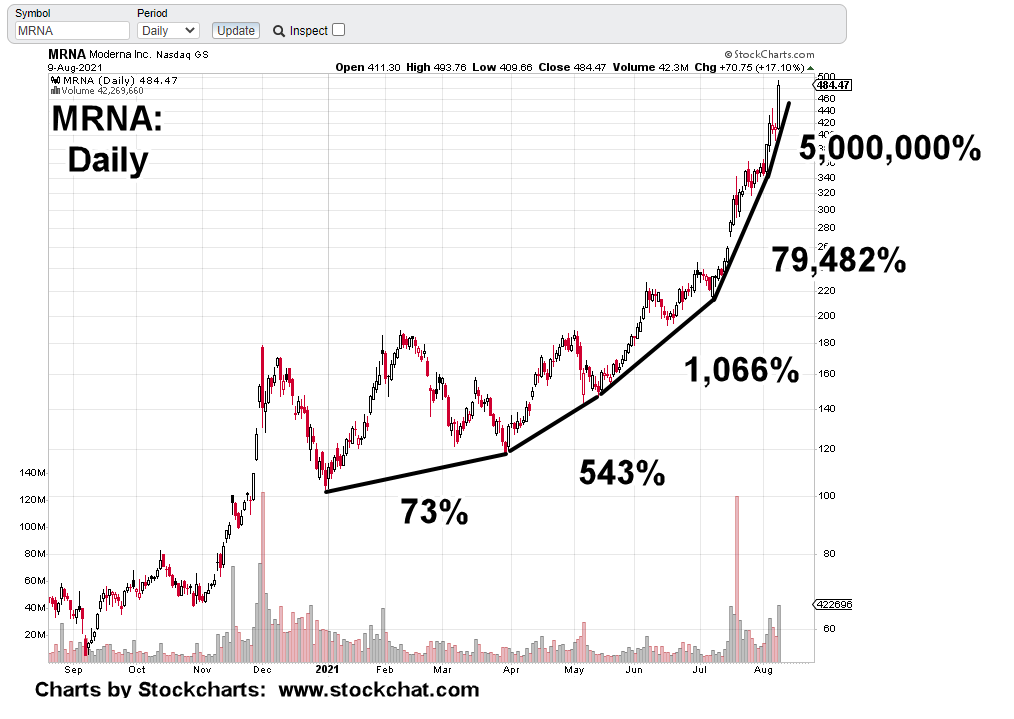
The MRNA daily chart shows price action trending higher at roughly 5-million percent on annualized basis.
This is the type of parabolic rise (and blow-off top) typically seen in commodities.
Obviously, you can’t keep 5-million percent going for long.
Moderna has now taken over Amgen (AMGN) as the largest cap in the IBB, biotech (ETF) index.
Amgen’s been trading since June 17, 1983. Moderna started just a little over two and a half years ago.

But let’s take a look at what’s really happening … what’s really going on behind the apparent good fortune of MRNA.
At one hour 22-miuntes and change, this link provides the most succinct account (to date) of the situation at hand.
Names, dates, places, patent numbers … it’s all there.
Pre-market trading in MRNA, shows a flat to slightly higher open.
Stay Tuned
Charts by StockCharts

Pingback: Biotech Breaking Down « The Danger Point®
Pingback: Moderna Djab, Investigated « The Danger Point®