SPBIO Going Straight Up For Two Weeks
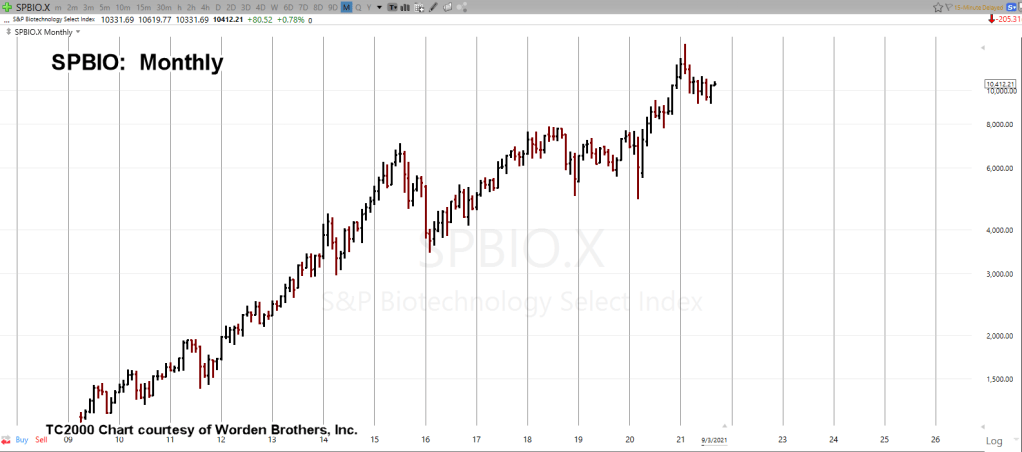
The big picture for biotech SPBIO, is above. The monthly chart shows a steady progression higher since 2009.
Stretching the monthly out a bit gives us the next chart:
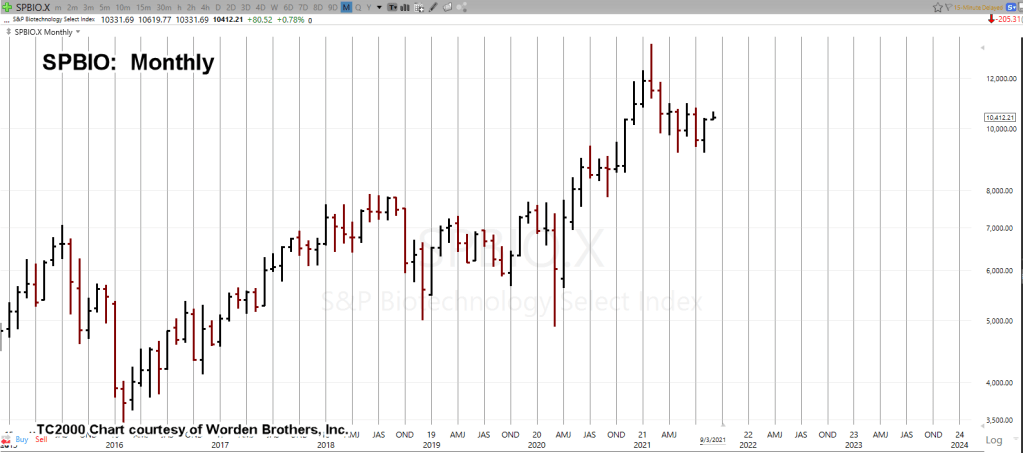
The two months of reversal back in February – March of this year are clear. Those two bars have yet to be negated. We’re still in a reversal lower until price action pushes back into that range.
Zooming into the monthly bars at the right side highlights a market anomaly; something called ‘the clustering of the closes’.

You can’t see it, unless you’re looking for it. Note how the blue line intersects a good number of the opens and the closes.
This location is an area of resistance. So far, price action can’t get appreciably higher than the resistance (blue line) area.
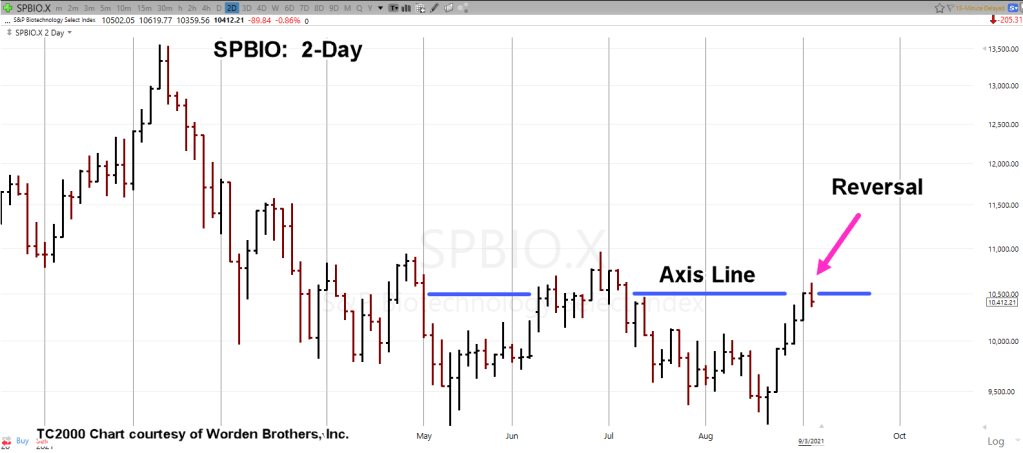
Drilling even further down to the 2-Day chart and we see the straight up action for the past two weeks … that has now contacted the axis (resistance) line and reversed.
So, was that two weeks a short squeeze?
Typically, once the shorts have covered, there’s not much left holding up the market.
Unless there’s a gap higher above the axis line at the next session, risk of going short at this location is low (not advice, not a recommendation).
Stay Tuned

Pingback: Biotech Short « The Danger Point®