Brief, And To The Point

The 3-Day chart of GDX inverse fund DUST above, has the vertical range compressed to better show the support/resistance boundary.
The boundary is shown close-up in the version below:
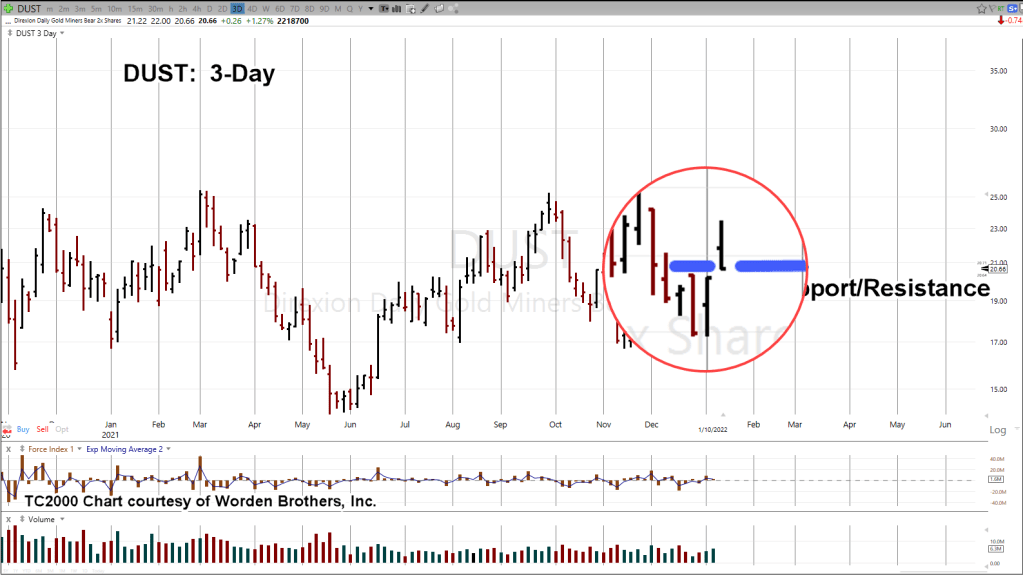
Coming back to test a boundary as shown is normal market behavior … there’s nothing (yet) that would indicate the direction of ETF GDX is changing its main direction from down to up … with DUST moving correspondingly lower (not advice, not a recommendation).
However, we’re potentially at another danger point where price action can go either way.
Stay Tuned
Note: Posts on this site are for education purposes only. They provide one firm’s insight on the markets. Not investment advice. See additional disclaimer here.
The Danger Point®, trade mark: No. 6,505,279
