Top of The Tops?

Here … ‘Hold this bag’.
Having been through the crash of ’87, ’98, ’01, ’08, and now, the feeling is similar.
Each time the vehicle (stock) is different but also the same, at the same time.
In case anyone wants to review, here’s the definition of ‘bag holder‘.
Is Now, The Time?
Previous analysis and potential top identification for NVDA, has been premature.
With that in mind, presented below are two charts.
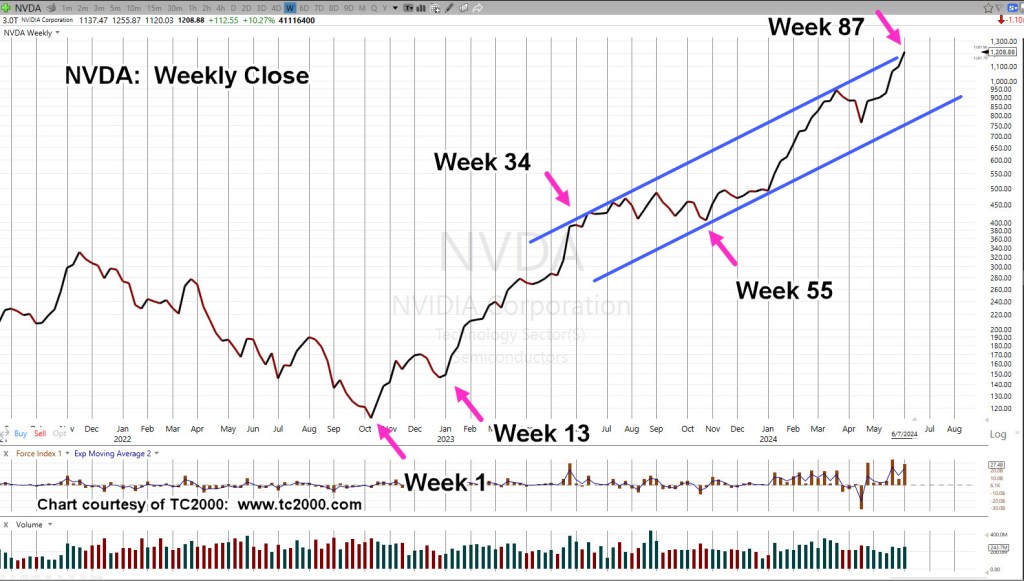
One has the Fibonacci count from the October ’22 lows; the other, shows a trading channel overlay.
The inference is, we’re close to some kind of ‘event’ whether it be sideways congestion or reversal (not advice, not a recommendation).
Nvidia NVDA, Weekly
It appears, since the October ’22 lows, NVDA is being influenced by a Fibonacci sequence.
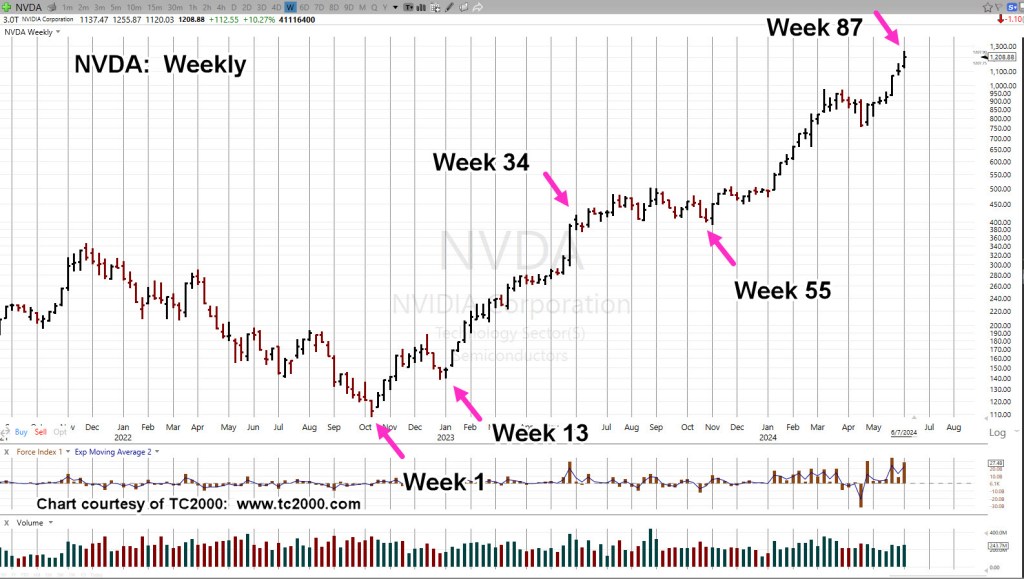
The ”close’ chart has the same Fibonacci count as well as the current trading channel.
Next week is ‘Week 88’, stock-split (10 to 1), as well as the Fed meeting.
Week 88, is within the margin of error for a precise Fibonacci count, Week 89.
With NVDA, at the top of its trading range, one needs to be on the lookout for some type of Fed/Stock-Split ‘overshoot’ or other indicator of potential upside limit (not advice, not a recommendation).
Stay Tuned
Charts by StockCharts
Note: Posts on this site are for education purposes only. They provide one firm’s insight on the markets. Not investment advice. See additional disclaimer here.
The Danger Point®, trade mark: No. 6,505,279

Pingback: It’s ‘Week 89’, for NVDA « The Danger Point®
Pingback: Nvidia Spit Top … Part II « The Danger Point®
Pingback: A Tale Of Two Tops … Nvidia « The Danger Point®