Note: Posts on this site are for education purposes only. They provide one firm’s insight on the markets. Not investment advice. See additional disclaimer here.
We have all kinds of Fed related kabuki on tap for tomorrow, link here.
From a Wyckoff standpoint, whatever the Fed says, the beige book or any other ancillary information, is of no-matter to what the market’s actually saying about itself.
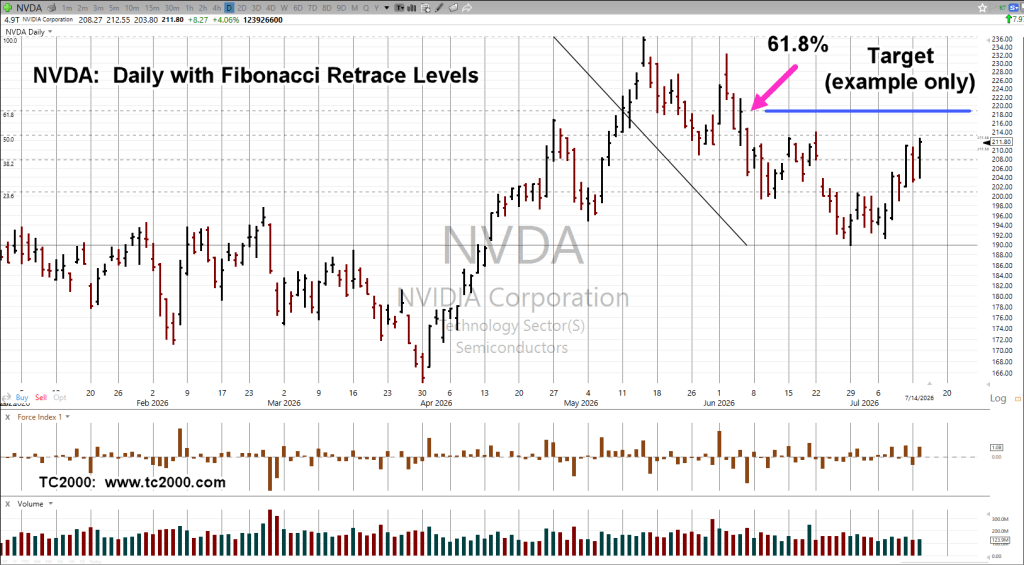
In the case of Nvidia and by correlation, the SOXX, gap distance discussed yesterday, is being narrowed.
Nvidia, NVDA, Daily
With the caveat, in the markets, anything can happen, nonetheless we see if NVDA gets to the target level to close the gap, that level is also a 61.8%, Fibonacci retrace (not advice, not a recommendation).
Note: Posts on this site are for education purposes only. They provide one firm’s insight on the markets. Not investment advice. See additional disclaimer here.
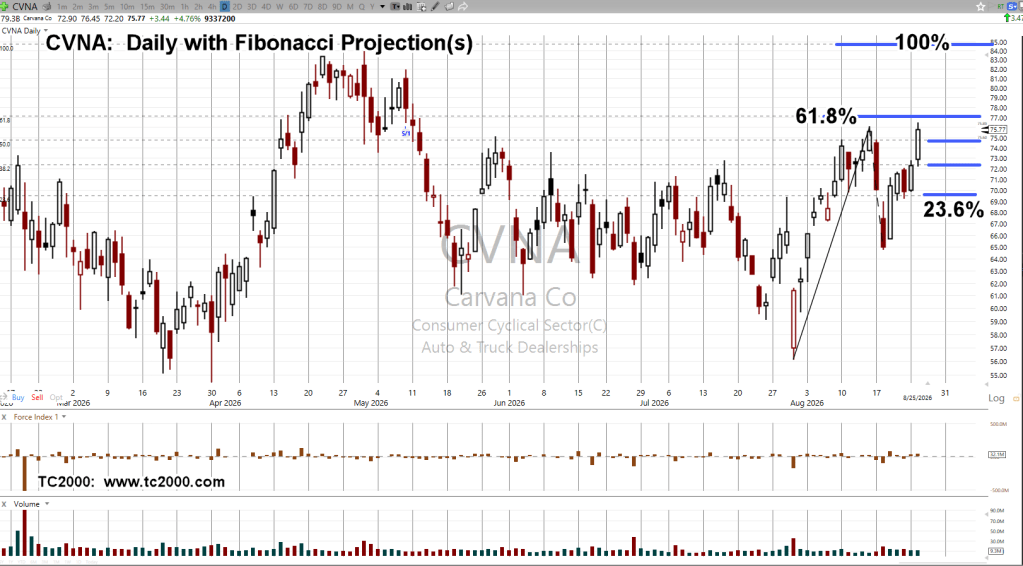
The last update on Carvana did not see how it was going higher but gave a potential price target, anyway.
At the same time, that update said:
“Note: Today’s break higher, then a pullback, puts CVNA in up-thrust position (not advice, not a recommendation).“
As of this post, CVNA has accelerated lower, penetrating support levels; that puts it in (minor) ‘spring’ position.
It’s possible there might be higher action (staying below the session high) into, during, or just after the Fed announcement (not advice, not a recommendation).
Note: Posts on this site are for education purposes only. They provide one firm’s insight on the markets. Not investment advice. See additional disclaimer here.
It’s no secret, Warren Buffet has been selling BAC, shares for some time; more recently, here.
The hard part is, how does one map that to price action?
Or does his selling have any material effect.
From a Wyckoff standpoint, we put that information in the background.
It’s there, we’re aware of it, but the focus is on price action itself.
So, let’s take a look.
BAC is a heavy weighting the in financial sector, with index tracking fund XLF, as a good vehicle for analysis.
That ETF just printed an all-time high this past Friday.
Financials XLF, Daily
Friday’s Fed announcement could be a significant infection.
Of course, the media is all aboard with a September cut, providing endless opinions on how to trade something that has not even happened.
What we’re looking for on this site, is some evidence of a reversal. We’re looking to see if price action stalls in not only the XLF, but the other major sectors as well.
Note: Posts on this site are for education purposes only. They provide one firm’s insight on the markets. Not investment advice. See additional disclaimer here.
Remember, markets typically move in the opposite direction first after the Fed, then resume their main trend.
On Friday, markets were generally higher on interest rate hopes. It’s called ‘hope’, as the Fed’s not actually done anything.
Let’s word that more accurately. The bond market has not (yet) told the Fed to lower rates. When it does (if it does), they will follow and present their case as if they are leading the market.
Decades ago, Robert Prechter Jr., in a research paper, proved this point. More recently, Ed Dowd repeats the fact, link here (time stamp: 37:48).
Markets were higher, including the SOXX, covered here, and in this update, airline sector Delta (DAL).
Delta Airlines, DAL, Daily
If there’s any one chart showing why this site primarily works the short side, this is it.
The last major move was an impulse downward, taking less than three-months.
The corrective move against the trend, has so far been nearly five months in choppy overlapping action.
DAL, finished on Friday at the Fibonacci 78.6%, retrace level (not shown). Unless the market decides otherwise, we’re in a terminating wedge.
Currently short DAL, as DAL-25-03, with stop just above Friday’s high (not advice, not a recommendation).
Weekend Wait
Now, the worrying starts … we can almost write the mainstream media script for the next few days.
Why will the Fed need to lower rates? Is unemployment going to continue higher? What about all the mass layoffs? How will the consumer be affected … and on and on.
As a reminder, ‘alternate’ (real) unemployment numbers are here. We’re already at 25%, Depression era levels.
Note: Posts on this site are for education purposes only. They provide one firm’s insight on the markets. Not investment advice. See additional disclaimer here.