Supplementary Data, Independant Source

Before we get to the ‘independent source’, a quick review of the June 21st, update (emphasis added):
“With the prior update letting us know the air is going out of support for continued A.I., today’s action may be a significant reversal (not advice, not a recommendation).”
That was based on a wide gamut of data with none of it, ‘fundamentals’, except ‘the money’s gone’; the conclusion, NVDA, may be at a significant inflection point (not advice, not a recommendation).
All of that, on this site, right here in River City. 🙂
Independant Source
Now, we have this from Ed Dowd, link here (time stamp: 5:45, 8:30, and 9:40) saying NVDA, had an ‘exhaustion top’, posting on two timeframes.
Note: Wyckoff analysis, with its century-old technique, is coming to the same conclusions as the Wall Street ‘number crunchers’ with near-infinite computing power.
Now, on to the chart.
Nvidia NVDA, Daily
The trading channel (blue lines) is potential only, not confirmed.
What we do have, is once again, NVDA being influenced by Fibonacci time-correlation(s).
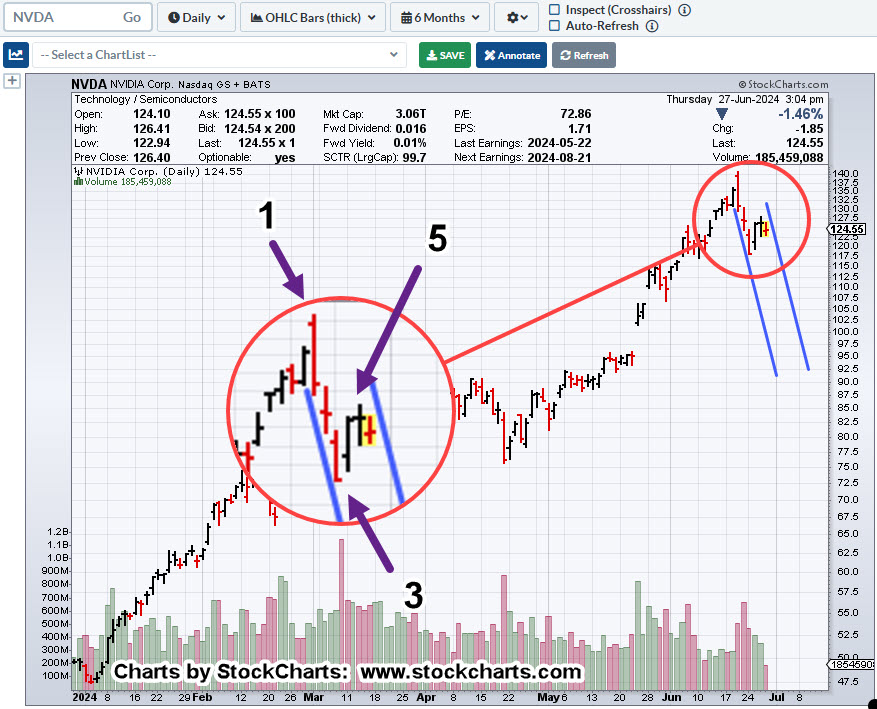
Nvidia reversed on Fibonacci Week 89, from the October 14th, 2022, lows.
Now, its adhering (so far), to daily Fibonacci.
Stay Tuned
Charts by StockCharts
Note: Posts on this site are for education purposes only. They provide one firm’s insight on the markets. Not investment advice. See additional disclaimer here.
The Danger Point®, trade mark: No. 6,505,279
