Are We There, Yet?

It’s been nothing but hysteria, for gold.
The following is just a partial list from the past few days:
Gold Soars To Another New High, What’s The Message? Link here. Website link here.
Gold Soars $145 in 48 hours as China Takes Charge, link here
What Is Gold Trying to Tell Us? Link here.
Bullion, Bonds, & Black Gold Bid, But Stocks Skid As Bessent Bats Down Beijing Deal Bets. Link here.
Short Dollar, Long Gold; But Goldman’s Hatzius Hedges Between Hard Data Catch-Down & Positive China Mood Swings. Link here.
Gold: Like a Cork in Water. Link here.
Whales And Minnows Swimming To Gold. Link Here. Website link here.
On, it goes.
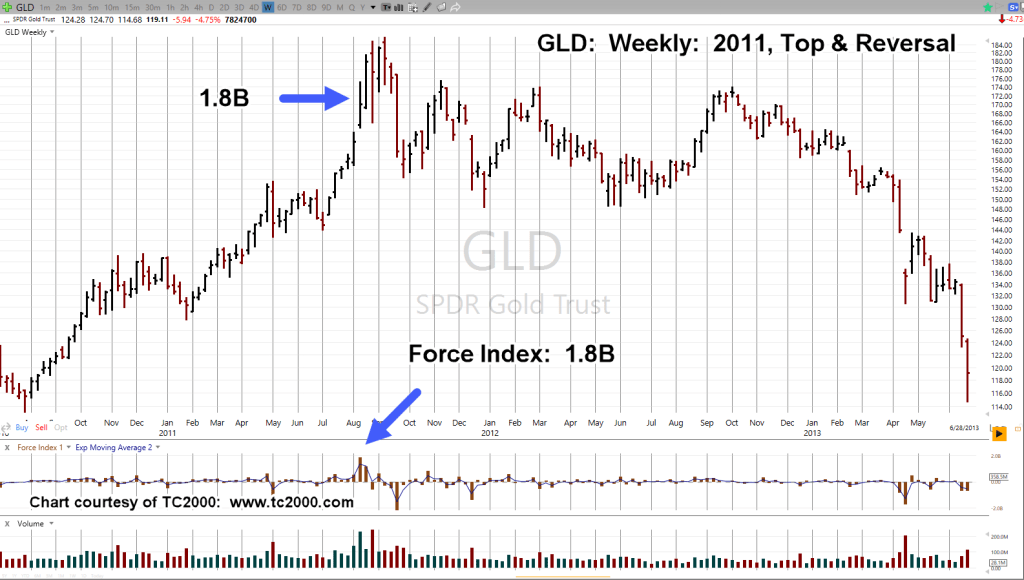
Gold GLD, Weekly: Then & Now
Shown below are two charts. The first is back from 2011, at the last major top.
The next chart is now.

Back in 2011, the massive Force Index, was posted before the high; a Fibonacci five-weeks, before.
Looking at the current chart, we have another massive Force Index, with the same value: 1.8B.
If the market follows the example of the past, we’re in that ‘fifth week’, now (not advice, not a recommendation).
Stay Tuned
Charts by StockCharts
Note: Posts on this site are for education purposes only. They provide one firm’s insight on the markets. Not investment advice. See additional disclaimer here.
The Danger Point®, trade mark: No. 6,505,279
