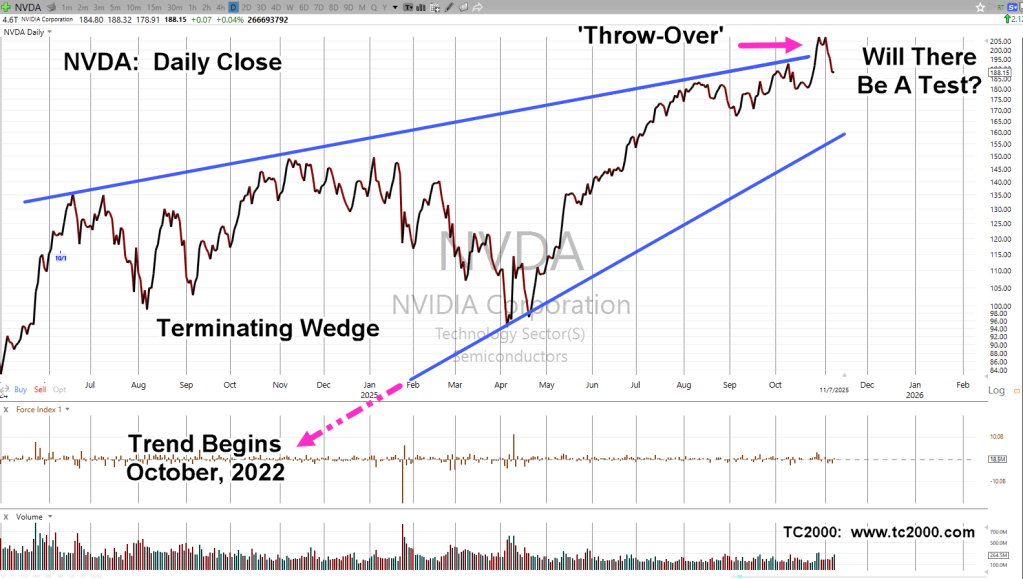
The last update, showed a wedge ‘throw-over’, then questioned (upper right of chart), ‘Will there be a test?’
Well, indeed there was a test (shown below). What happens next?
From one of Ed Dowd’s latest interviews, link here (Time Stamp: 4:30), he talks about ‘intervention’ within the A.I. bubble. He’s referring to news of this link.
His point: He thinks as a result of government equity stake, there could be ‘one more thrust higher’ before reversal.
The suggestion on this site, the news is already out.
The thrust higher may have already happened (not advice, not a recommendation).
Nvidia NVDA, Daily Close
There’s always the possibility of a secondary test.
However, if NVDA has actually completed its throw-over test, and reversed, the example at this link (video), shows it can all fall apart very quickly (not advice, not a recommendation).
Note: Posts on this site are for education purposes only. They provide one firm’s insight on the markets. Not investment advice. See additional disclaimer here.
It could be a slow grind, a series of ‘air-pockets’, or of course, not at all.
Using time-tested classical analysis, along with a dash of Elliott Wave, shows us we just had a terminating wedge ‘throw-over‘.
The video in the attached link, is brief and concise.
Throw-overs are (typically) major reversal indicators (not advice, not a recommendation).
As of yesterday, Friday, that’s where we are.
Nvidia NVDA, Daily Close
As seen with Nvidia, literally anything can happen. It could somehow recover, go sideways, or collapse.
If price action gets to the lower wedge, then breaks down, the ‘measured move’ for such a break, is -80%, to -90%, lower (not advice, not a recommendation).
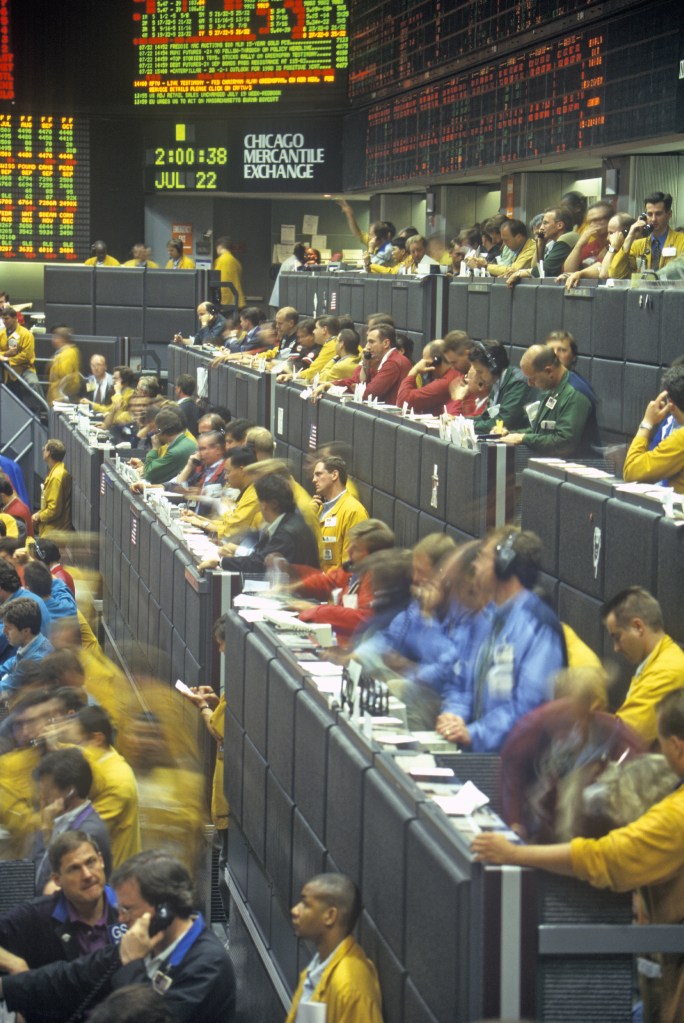
Crash in The Past
The crash of 1899, shows us that just because we got past October without fanfare, a crash can happen at any time.
A prior update, written three-years ago, describes that crash, link here.
Note: Posts on this site are for education purposes only. They provide one firm’s insight on the markets. Not investment advice. See additional disclaimer here.
Based on price action itself, the miners are refusing to retrace higher.
The last update suggested a retrace to the usual location(s), at least the 38.2% level, the vicinity of ‘wave iv’.
So far, not even that is happening.
Senior Miners, GDX, Daily
Pre-market trading in GDX (as of 8:24 a.m., EST) is lower.
At this point, from the chart above, we can see the index struggling to move higher.
Elliott Wave or not (from previous post), Wyckoff method says the market itself defines the next likely move.
It’s possible we’re not at the bottom of the current down leg; that we’ll post lower before making a serious retrace attempt (not advice, not a recommendation).
Note: Posts on this site are for education purposes only. They provide one firm’s insight on the markets. Not investment advice. See additional disclaimer here.
Note: Posts on this site are for education purposes only. They provide one firm’s insight on the markets. Not investment advice. See additional disclaimer here.
Note: Posts on this site are for education purposes only. They provide one firm’s insight on the markets. Not investment advice. See additional disclaimer here.
Note: Posts on this site are for education purposes only. They provide one firm’s insight on the markets. Not investment advice. See additional disclaimer here.
Note: Posts on this site are for education purposes only. They provide one firm’s insight on the markets. Not investment advice. See additional disclaimer here.
For a clue to the (potential) answer, we can look at what’s happening to Pfizer, link here and here.
However, let’s not get ourselves wrapped around the axle on events, forecast years ago.
Rather, let’s go straight to the truth, the price action and see what it’s telling us.
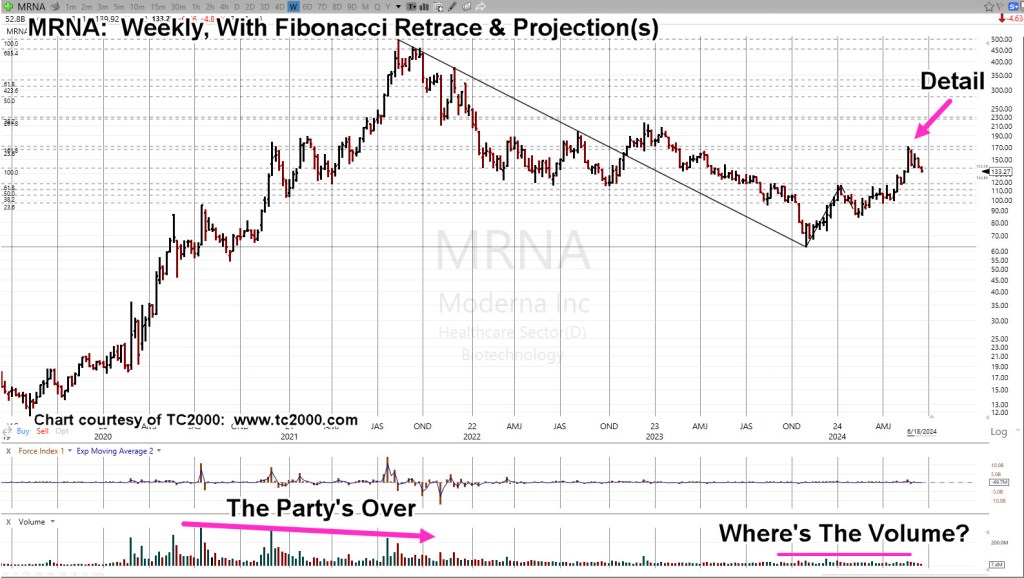
Moderna MRNA, Weekly
The entire move from low to highs is shown. Included on the chart, are two Fibonacci indicators.
One is the standard ‘retrace’ indicator; the other, is a ‘projection’ indicator.
The ‘projection’ is based off the ‘a-b-c’ move from the lows of November 2nd, 2023, to the highs on May 24, 2024.
The retrace and projections are hard to see, so the ‘Detail‘, arrow is where we’re headed next on the daily.
Moderna MRNA, Daily
If there ever was a chart to once-and-for-all, refute, dismiss, trash, the whole ‘Fundamentals’ argument, that earnings, interest rates or some other ‘Voodoo economics’, moves prices, this is it:
MRNA, price action hit the 23.6% retrace level (exactly) for two days before moving on to hit the 161.8%, projection (exactly) before reversing.
Note the ‘100%‘ level as well; price action confirmed this area (exactly) three times! Once on the way up and two times on the way down (third time, not shown).
A century ago, Livermore said, ‘It’s all about the numbers’.
Strategy, First
Just as Livermore was primary a strategist, so is this site’s method of analyzing the markets, i.e., Strategy, Tactics, Focus, in that order (not advice, not a recommendation).
The news has been replete with reports like this one and this one.
Another panic ahead?
Sounds like it but at least in the case of Moderna, the chart itself says (effectively):
‘There’s no money in it’.
That means, another wave like we saw several years ago, is not the most likely future event (not advice, not a recommendation).
Note: Posts on this site are for education purposes only. They provide one firm’s insight on the markets. Not investment advice. See additional disclaimer here.
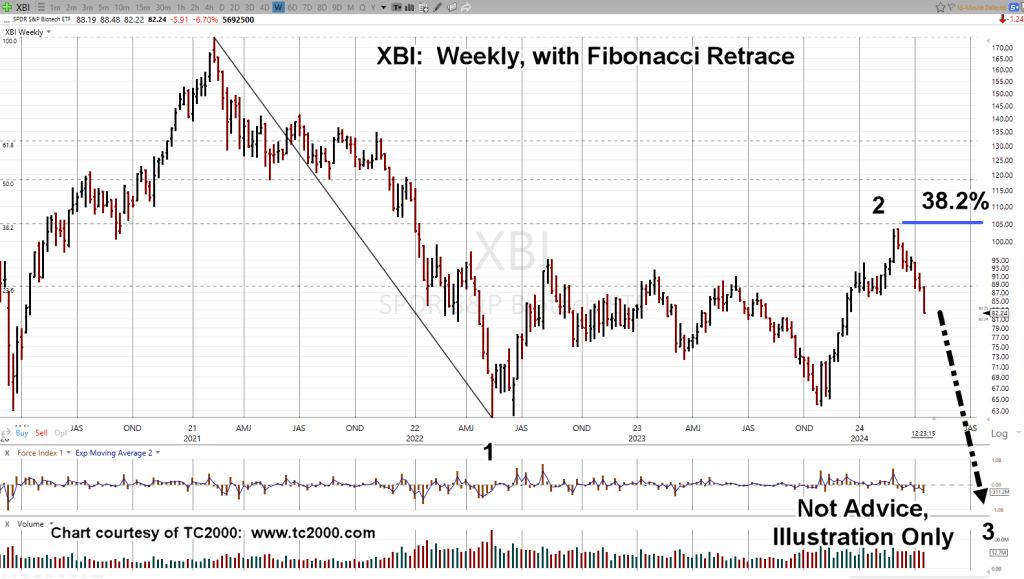
In the case of biotech XBI, it may have started the ‘dynamic phase’, suggested two days ago, in this update.
Then, there’s Elliott Wave.
Back in the day, while being mentored by the late David Weis, he revealed his ‘love/hate’ relationship with the method.
His quote to me was “Intermittent reinforcement, is a hook”; meaning, it works just well enough (but not profitably enough) to keep you coming back to ‘get it right’ next time … which never comes.
For me, I’m not going to use the approach for trading decisions, but highlight in the case of XBI, we just might have an Elliott Wave structure (not advice not a recommendation).
Biotech XBI, Weekly
If this structure’s correct, a lot can happen on the way to the end of ‘Wave 3’.
Note the XBI, topped-out right at the 38.2%, retrace in March (labeled, as ‘Wave 2’), before reversing lower.
Big In, Big Out
The chart above is a massive structure; years of action to form the top, reversal, counter trend wave, then reversal again, which is where we are now.
Note: Posts on this site are for education purposes only. They provide one firm’s insight on the markets. Not investment advice. See additional disclaimer here.
As with the Carvana analysis, a year ago which said CVNA, would likely not survive, so too it would appear, biotech is about to join the ranks.
Join the ranks but for different reasons.
Price action leading the news was a concept presented decades ago by Robert Prechter Jr., as part of his Elliott Wave Theory.
His view was the market indicates ‘social mood’; in that case, the market must go down first, before the bad news comes out.
In effect, the public has to be ready and actually want bad news and/or be ready for unexpected, cataclysmic events.
It’s the complete opposite of the accepted mantra, from financial advisors and media alike.
The bear flag in biotech SPBIO, has been forming now for three months. In the history of this sector, there’s never been anything like it.
The last update said there’s been a change in the character of price action; that SPBIO, is heading lower and about to threaten the bottom of the flag.
As we’ll see from the daily chart, indeed we’re getting close.
At this point, there’s no apparent demand for the upside.
Biotech SPBIO, Daily
The change in character is clear. We’re pulling away from the top of the flag and now, hovering at the lows.
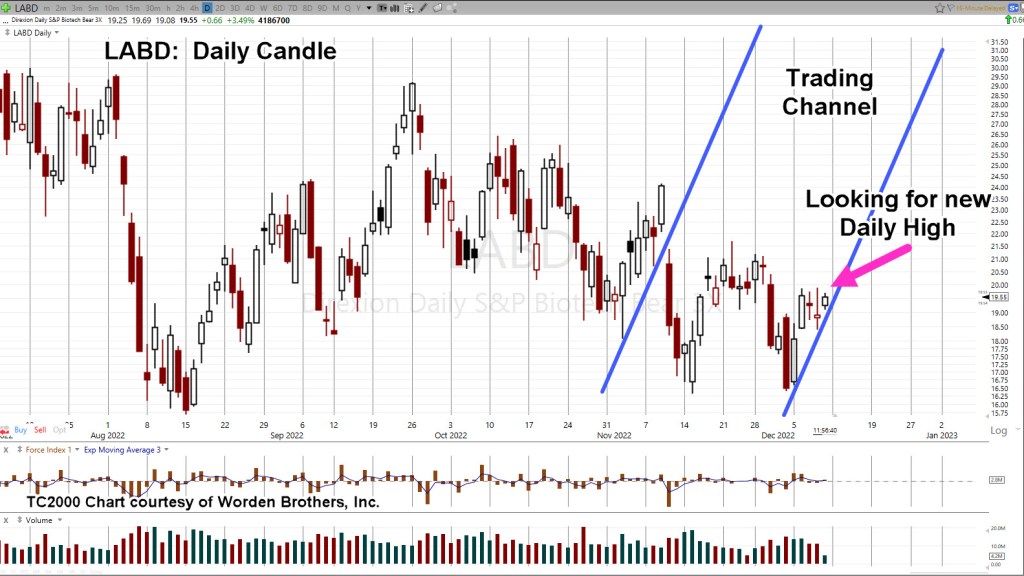
Switching gears and going to the 3X leveraged inverse fund LABD, on the daily basis, we see repeating trend lines.
SPBIO, 3X Leveraged Inverse LABD, Daily
As the magenta arrow shows, we’re looking for a new daily high in LABD, to confirm the trendline; that high would naturally correspond to a new daily low in SPBIO.
As of this post (1:02 p.m., EST) neither one has occurred.
Summary
Even as the overall markets are mixed to slightly higher, SPBIO, is posting down – 1.51%; a possible indication it may lead to the downside.
Just exactly what ‘news’ is about to come out is unknown.
However, at this juncture with action pressing lower, it appears, the market is ready.
Positioning
Not advice, not a recommendation.
LABD-22-14
Entry@ 18.905, 18.95*** Stop @ 18.36***
Note: Positions may be increased, decreased, entered, or exited at any time.
Note: Posts on this site are for education purposes only. They provide one firm’s insight on the markets. Not investment advice. See additional disclaimer here.