Fibonacci, still In-Effect?

Insight on Nvidia’s adherence to Fibonacci, began over a year ago, with this post.
That update, identified the (interim) reversal correctly.
Since then, price action continued and has now, this (shortened) week, posted another potential correlation.
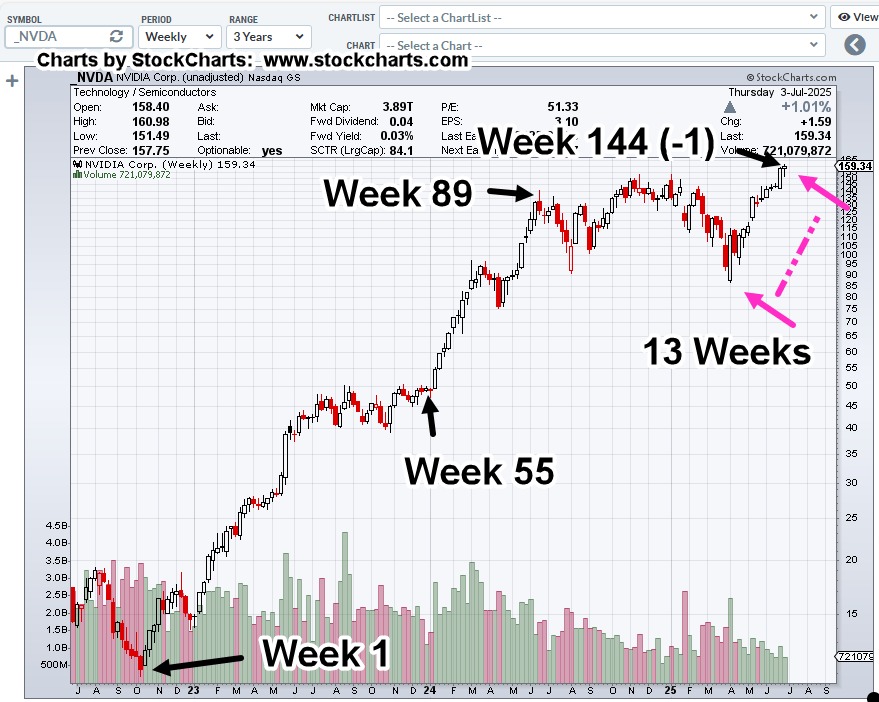
Nvidia NVDA, Weekly
The week closed with a high, 55-weeks from the ‘Week 89’ high, making a total of Fibonacci 144 (-1) weeks, from the October 2022, lows.
One might ask, can it be this precise?
To answer that question, we’ll go back to this analysis.
The next (trading) day, Junior Miners GDXJ, printed a new daily high (55-Days), then reversed lower for 24-weeks, a total decline over 50%.
So, it turns out, it can be that precise if market conditions are in favor, and nobody’s looking (not advice, not a recommendation).
Stay Tuned
Charts by StockCharts
Note: Posts on this site are for education purposes only. They provide one firm’s insight on the markets. Not investment advice. See additional disclaimer here.
The Danger Point®, trade mark: No. 6,505,279

Pingback: Livermore’s Laws … Positioning « The Danger Point®
Pingback: SOXX, at The Edge « The Danger Point®