Testing The Break
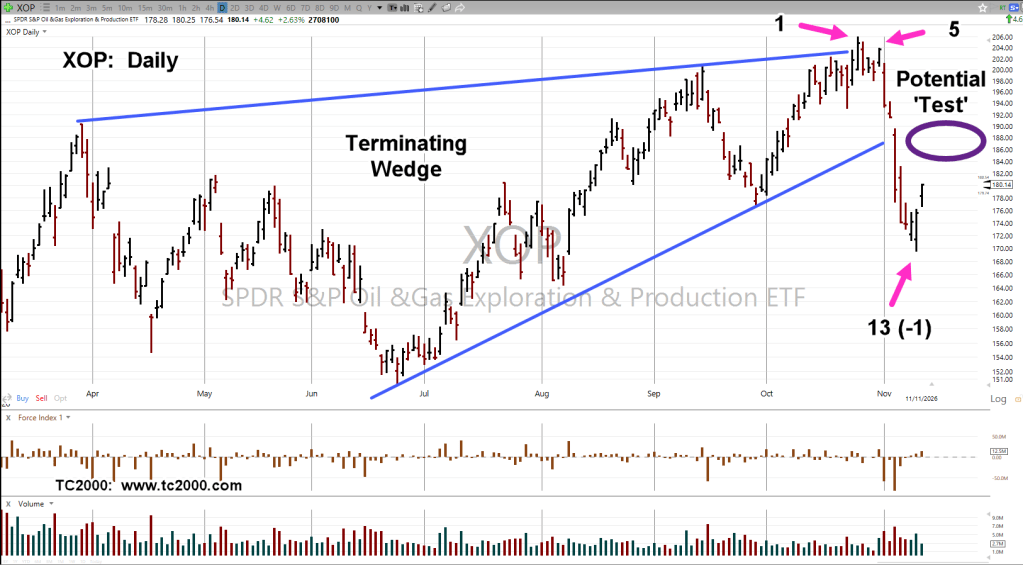
The day after the wedge ‘throw-over’, labeled as No. 1, on the chart was this post, link here.
Three days after that, labeled as No. 5, was the last of the upside before the largest (oil price) collapse since 2020, link here.
The chart shows a potential area for the ‘test’ (not advice, not a recommendation).
Stay Tuned
Charts by StockCharts, TC2000
Note: Posts on this site are for education purposes only. They provide one firm’s insight on the markets. Not investment advice. See additional disclaimer here.
The Danger Point®, trade mark: No. 6,505,279

