Axis Line

Spotify has been in a sideways, to higher range, for a very long time; since December of last year.
Looking at it from a Wyckoff perspective, this range represents congestion, or in his words, ’cause’.
What’s missing at this point, is what he calls the ‘effect’; the result of the cause.
Spotify SPOT, Daily Close
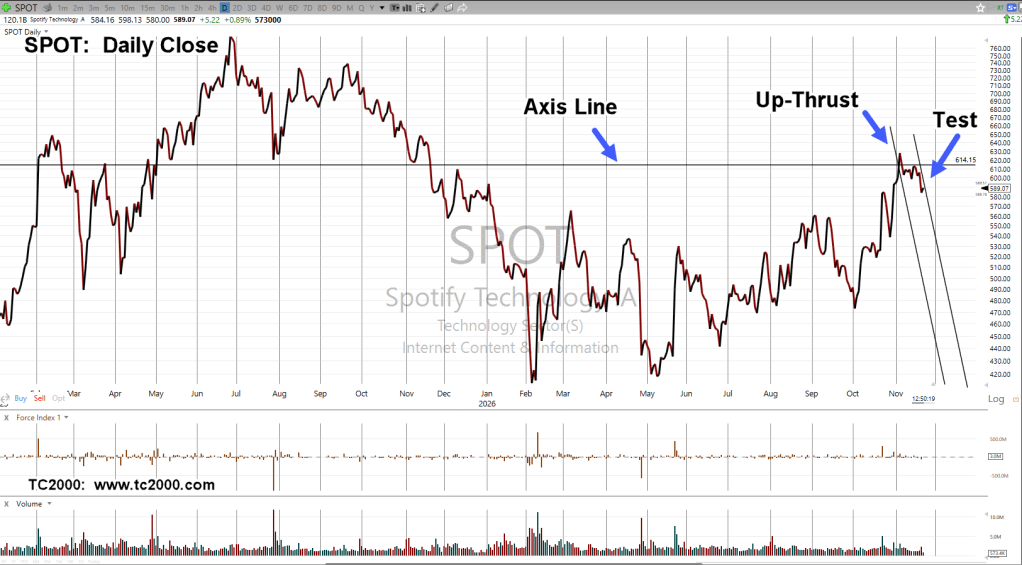
We’re at mid-session and this is how it looks for SPOT.
There’s an up-thrust.
Then, today, a test within the trading range.
The inference is lower prices ahead (not advice, not a recommendation).
Stay Tuned
Notice:
On or before January 1st, of 2027, this site will go private and no longer be available to the public.
Charts by StockCharts, TC2000
Note: Posts on this site are for education purposes only. They provide one firm’s insight on the markets. Not investment advice. See additional disclaimer here.
The Danger Point®, trade mark: No. 6,505,279

