Note: Posts on this site are for education purposes only. They provide one firm’s insight on the markets. Not investment advice. See additional disclaimer here.
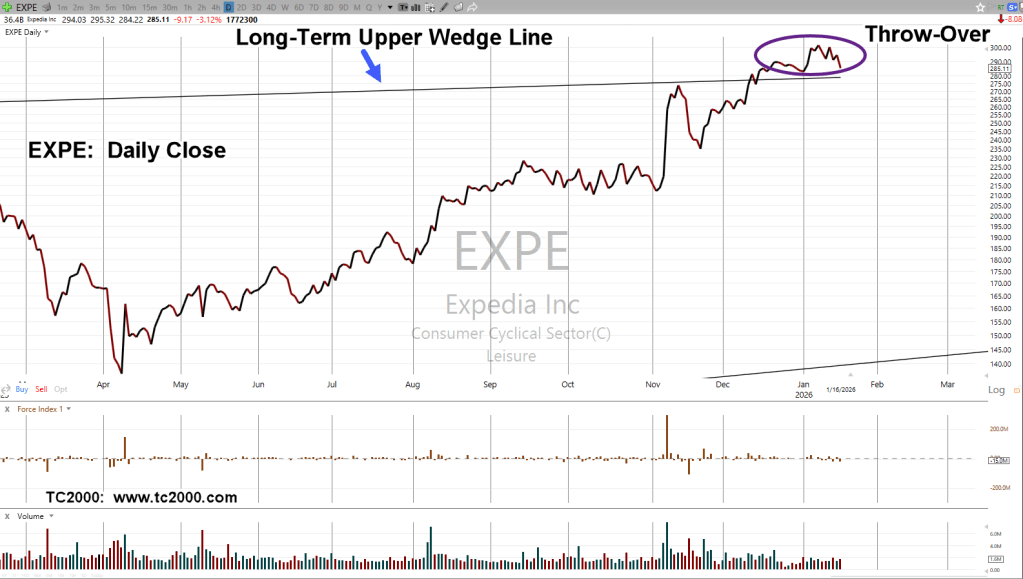
The wedge trendline in the long-term chart (link above) can be seen on the daily; price action’s oscillating, potentially reversing, in a throw-over (not advice, not a recommendation).
Note: Posts on this site are for education purposes only. They provide one firm’s insight on the markets. Not investment advice. See additional disclaimer here.
Note: Posts on this site are for education purposes only. They provide one firm’s insight on the markets. Not investment advice. See additional disclaimer here.
Carvana, launched itself above resistance at Friday’s close. In so doing, got itself into another wedge.
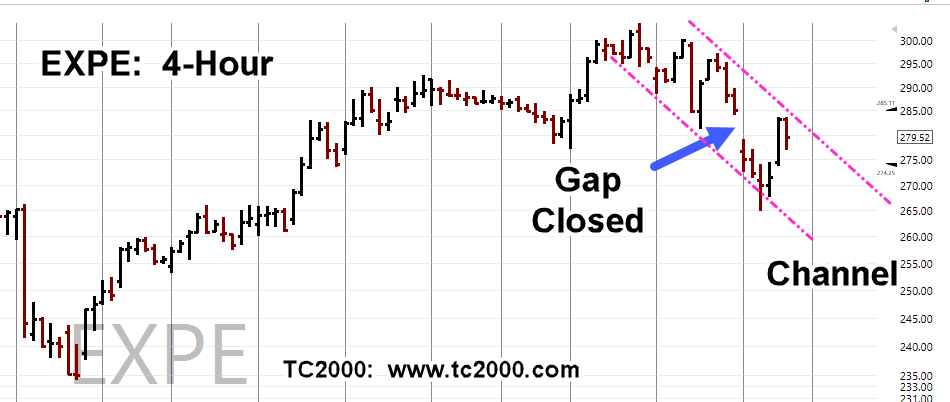
Now we have Expedia, looking eerily similar (not advice, not a recommendation).
Like eBay, we’ll start with the long term, quarterly chart.
Expedia EXPE, Quarterly
The latest earnings release pushed EXPE up, contacting the upper trendline.
A gap higher and close of +17.55%, in one day.
EXPE has since backed off the all-time high; currently down about -8.5%.
Edge of The Wedge
The following is a partial list of tickers either forming a (monthly) terminating wedge, or have broken out to the downside (not advice, not a recommendation)
Note: Posts on this site are for education purposes only. They provide one firm’s insight on the markets. Not investment advice. See additional disclaimer here.