SLV, Targeting Single Digits

Silver’s an industrial metal and that industry worldwide, is in full-blown collapse.
Maersk reports shipping trade implodes.
Warehouse vacancy space in California’s industrial sector is increasing and the consumer, may have finally spent themselves into oblivion.
Let’s throw on top, the food supply continues to contract just as forecast.
With all that, one can ask:
‘Just how’s silver going to enter into a bull market under these conditions?’
So far, since this post and this one, over two years ago, it hasn’t (not advice, not a recommendation).
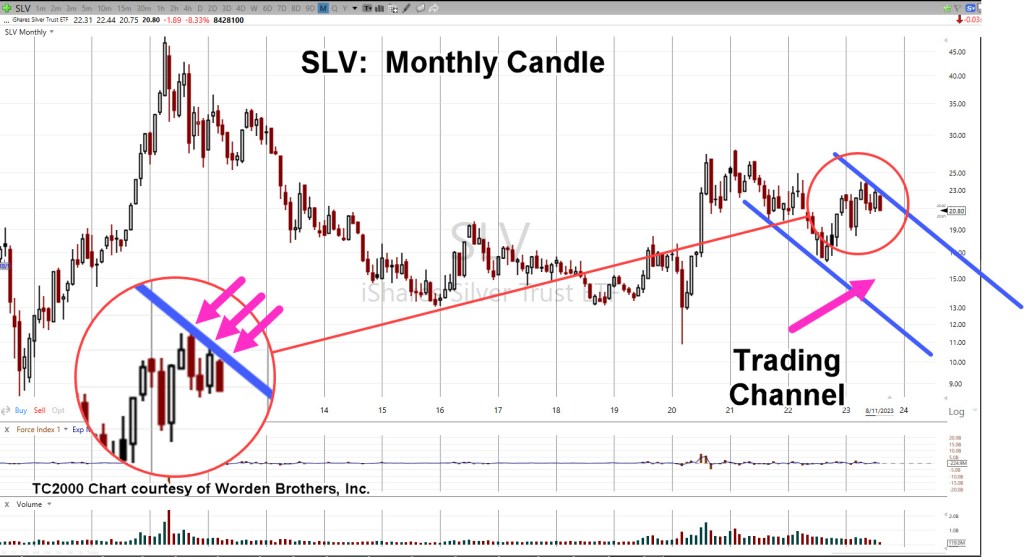
A New Down Channel
Silver continues its bear market that started way back in April, of 2011.
However, early-May and late-July peaks in SLV, appear to confirm the right side of a new down channel.
Silver SLV, Monthly Candle
With successive hits on the right side, trending down, there appears to be a significant barrier to moving higher.
The next chart uses a standard Fibonacci projection tool, showing potential downside targets.

The critical area on the chart is the ‘23.6%’ projection to the SLV 19-area.
If price action retraces to this level and then starts to change character, it’s a possible bullish indication.
If not, and we push lower, SLV then continues on with its decade-long decline.
Sovereign Default … Waiting
There’s a lot of world-wide debt built up in the system.
China appears ready to collapse into a real estate depression … probably co-incident with our own.
Couple that with record level stock valuations, record margin borrowing and mass psychosis, not seen since at least South Sea Bubble of 1720.
Could it be, among many trigger-events, we get a sovereign debt crisis (assets dumped to pay debt) that send both gold and silver to much lower levels?
Stay Tuned
Charts by StockCharts
Note: Posts on this site are for education purposes only. They provide one firm’s insight on the markets. Not investment advice. See additional disclaimer here.
The Danger Point®, trade mark: No. 6,505,279
