Price Action Confirming Fibonacci
It’s just past midway through the session.
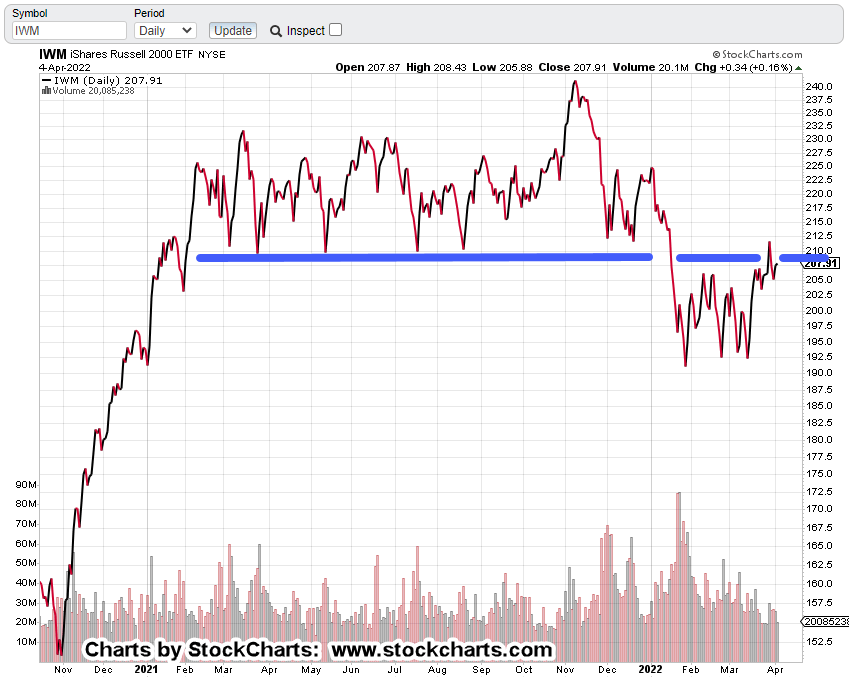
The weekly chart of Russell 2000 IWM, is hovering at the first projection level … 23.6%.
Russell 2000, IWM, Weekly

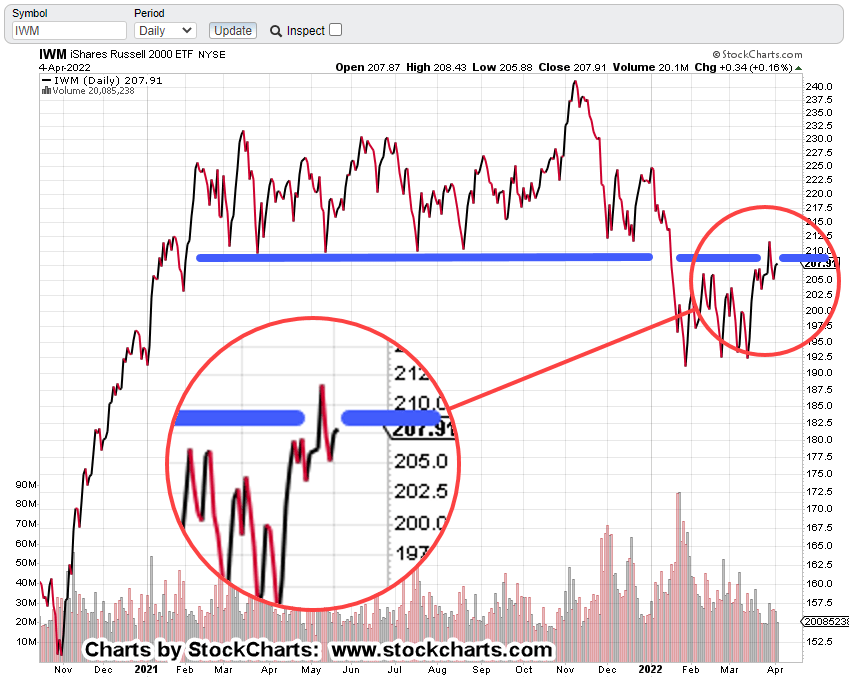
We’ll get closer in, using the 4-Hour chart

Note how price action is oscillating about the 23.6%, level.
This type of behavior provides confirmation the market ‘respects’ that level.
Note in the weekly chart, there are no fewer than six weekly bars (including this week) that either had an open or close, near 23.6%.
As this post is being created, the market appears to be pivoting out and down from this area.
It may be on its way to lower levels (not advice not a recommendation).
Stay Tuned
Charts by StockCharts
Note: Posts on this site are for education purposes only. They provide one firm’s insight on the markets. Not investment advice. See additional disclaimer here.
The Danger Point®, trade mark: No. 6,505,279