Bullish & Bearish

For the past six months, the overall strategic assessment of silver has been consistent; sideways to bearish.
Stategic, because there are always opportunities for bulls and bears if your timeframe is short enough.
Six months ago in May, the high for silver SLV, was 29.56. So far this month, the high is 30.01, a +1.52% difference.
Not exactly ‘sideways’ but as we’ll see below, it’s potentially bearish (not advice, not a recommendation).
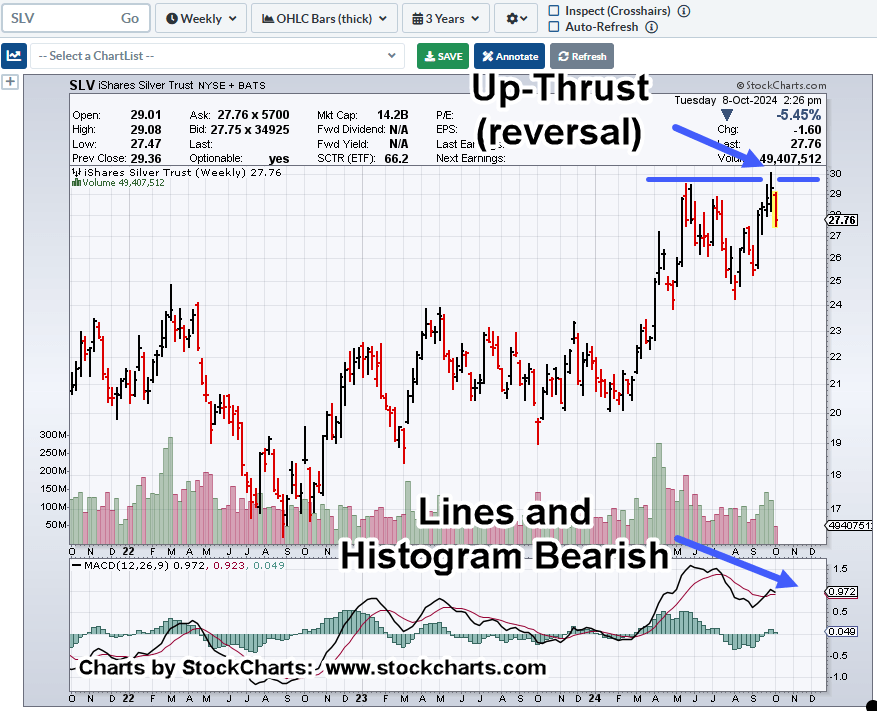
Silver SLV, Weekly
The measured move, discussed back in May, link here.

Back then, at the link above was this:
“The coming week could see SLV, inch its way higher to the measured move or continue the testing (possibly, reversal) action it started last week.“
Well, it took SLV, nineteen-weeks to ‘inch its way higher’ to just tap the measured move target.
All of which brings us to the next chart.
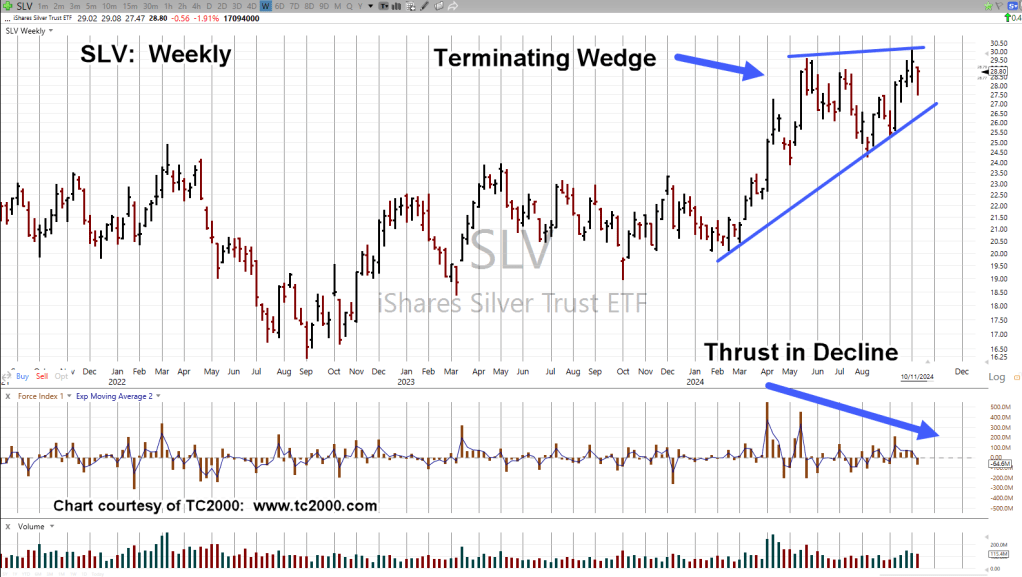
If the wedge is in-effect and SLV breaks down, depending on location, SLV, target could be in the vicinity of 20 – 22 area (not advice, not a recommendation).
Stay Tuned
Charts by StockCharts
Note: Posts on this site are for education purposes only. They provide one firm’s insight on the markets. Not investment advice. See additional disclaimer here.
The Danger Point®, trade mark: No. 6,505,279