While the markets grab headlines of all time highs, biotech’s at the crossroads of collapse.

This site has zeroed in on the most likely candidate to head decisively lower once the bubble has burst.
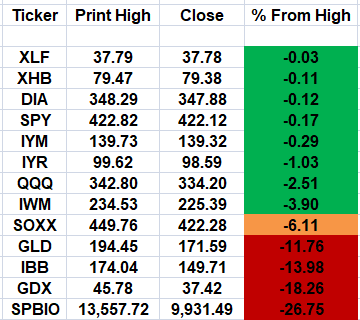
In fact, if we look at the table of tracked markets below, biotech’s SPBIO, has taken over downside leadership.
Next to last is GDX; the senior mining index.
Repeated many times before, this sector is overcrowded with delusion on both sides. From a trading standpoint, no thank you.
Daily and monthly charts of biotech SPBIO are below. Both charts are inverted and have Fibonacci projections.
The charts are essentially clean so they don’t clutter the data.
Daily SPBIO (inverted):

Monthly SPBIO (inverted):

If SPBIO gets to the extreme Fibonacci projection of 261.8%, it will represent a sector decline of just over -92%.
Sounds about right; not advice, not a recommendation.
Recall, from the 1929 highs to the lows in 1932, was around -84% (depending on the source).
Under those extreme circumstances, -92% decline is not unreasonable.
Of course, if a collapse does happen, it’s not likely to go straight down. The entire ’29 crash did not go straight down either. There were many false rallies on the trip to the bottom.
