The Volume Speaks

Nearly everyone expects gold to go higher; much higher.
You want ‘clicks’ on your website? Then talk about how gold’s going to the moon.
It’s an easy grift. Everybody’s doing it.
However, gold’s truth is in the price action, not the grift.
We’re going to look at that truth and more specifically, what gold’s (GLD) volume is telling us.
With full understanding that anything can happen, gold could go higher, there’s a case for a significant downside reversal (not advice, not a recommendation).
Gold GLD, Weekly
In Wyckoff analysis terms, volume is the energy behind the move. It’s the commitment … or lack thereof.

Last week’s volume is far below the prior spike high set during the ‘invasion’.
It’s down over 56% from the ‘invasion’ spike and down 26% from the most recent spike.
Demand, commitment and thrust energy, are backing away from the gold market.
Moving down to the daily, we see the net distance traveled with each significant thrust is shorter than the last.
Gold GLD, Daily Close
Wyckoff wrote about this observation a century ago when discussing how to spot the end (or absorption phase) of a move.
He called it ‘shortening of the thrust’.
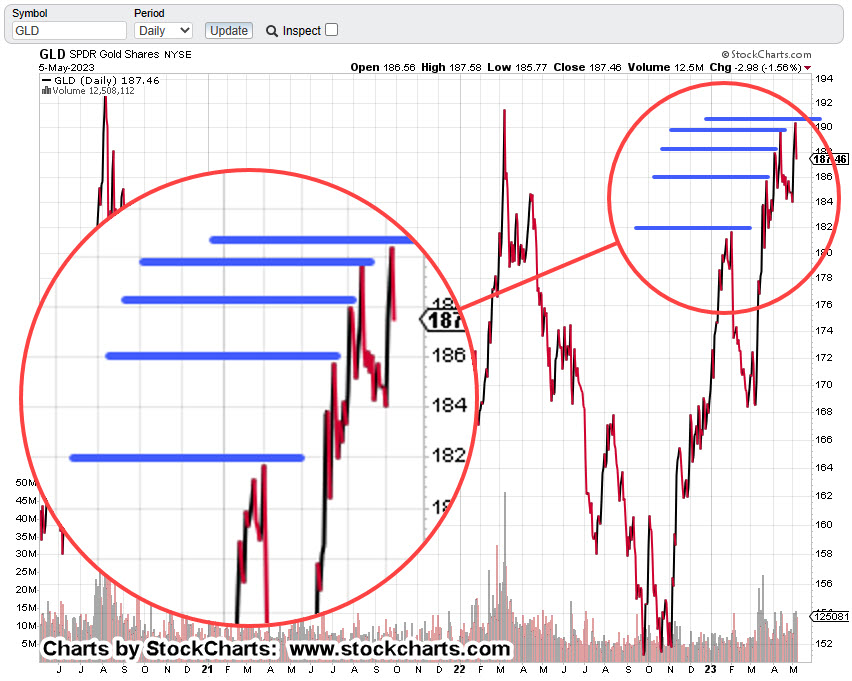
So, there it is. The weekly chart shows each major volume spike is less than the last.
The daily close has net distance traveled less than the last.
Add in the mining sector’s GDXJ, posting its most recent peak four weeks ago (week ended April 10th).
Last week’s action in the Junior’s appeared to be an act of desperation by the bulls.
We’ll cover that sector in the next update.
Stay Tuned
Charts by StockCharts
Note: Posts on this site are for education purposes only. They provide one firm’s insight on the markets. Not investment advice. See additional disclaimer here.
The Danger Point®, trade mark: No. 6,505,279

Pingback: Miner’s Reversal … Still Early « The Danger Point®
Pingback: Gold At The ‘Wedge’ « The Danger Point®
Pingback: Kabuki ‘Debt Ceiling’, & Gold « The Danger Point®
Pingback: Kabuki ‘Debt Ceiling’, & Gold — The Danger Point® – The Fourth Estate
Pingback: When Costco Sells Gold « The Danger Point®