Was That, ‘THE’ Top ?

Beginning at time stamp 6:24, at this link, The Maverick goes through an investigation into NVDA, projections.
‘Something doesn’t add up here ….’
That report was three weeks ago. What’s happened, lately?
As of the close this past Friday, NVDA, the largest in the SOXX, was at $1.1-Trillion, market cap. A distant second, is Taiwan Semi (TSM) at $545.5-Bln.
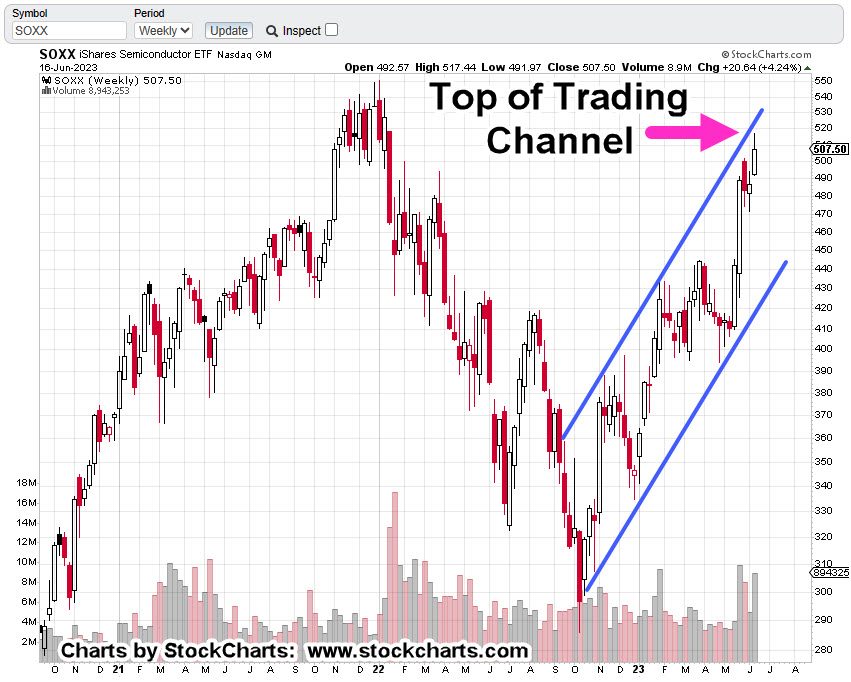
Below, we have a confluence of events for the SOXX.
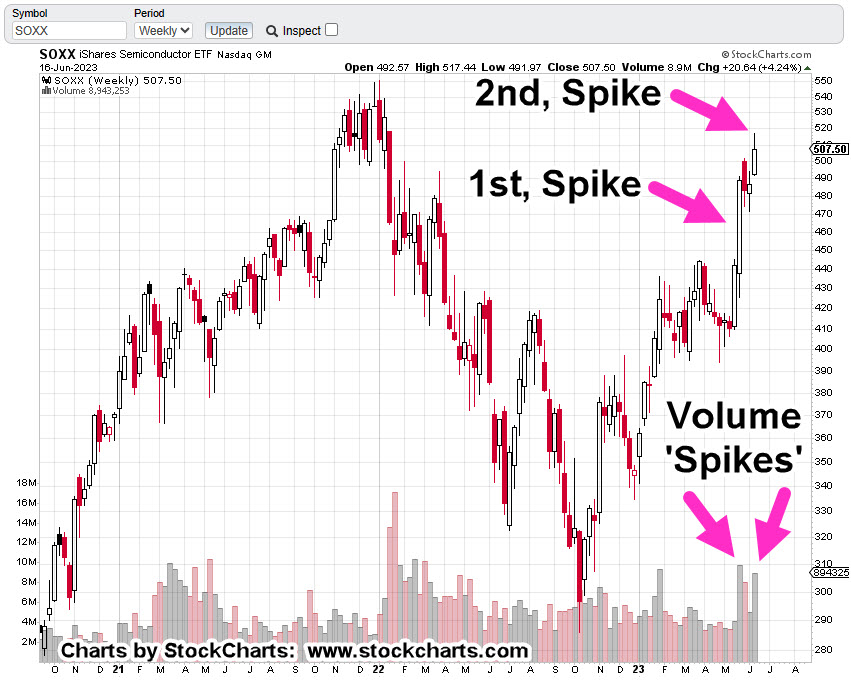
Semiconductor (ETF), SOXX, Weekly Candle
We’re at the top of a trading channel.
We’re in Wyckoff ‘Up-Thrust’ (reversal) position.

A lot of volume expended with less (net) upward progress than previous volume spike; ‘effort vs. reward’.
Getting down to the daily, we see a terminating wedge that’s coupled with reduced volume.
Semiconductor Index SOXX, Daily Candle

So, what does that mean?
The ‘probabilities’ for more upside are, or have been, reduced significantly (not advice, not a recommendation).
Stay Tuned
Charts by StockCharts
Note: Posts on this site are for education purposes only. They provide one firm’s insight on the markets. Not investment advice. See additional disclaimer here.
The Danger Point®, trade mark: No. 6,505,279

Pingback: ‘Show Me The Money !’ … NVDA « The Danger Point®
Pingback: Managing The (SOXS) Trade « The Danger Point®