Count of The Fibonacci

While the media’s wasting no time setting up the average investor, for a ‘guaranteed skinning’ (as Dr. Elder used to say), providing an environment of constant, incessant, AI ‘get-in-now’, buy recommendations.
With that said, an ominous market sign has appeared.
As the daily chart of SOXX shows, we either have a breakout or a hole that’s about to be filled (reversed).
Semiconductor Index SOXX, Daily
In technical terms, the SOXX is in Wyckoff ‘Up-Thrust’, reversal position (not advice, not a recommendation).
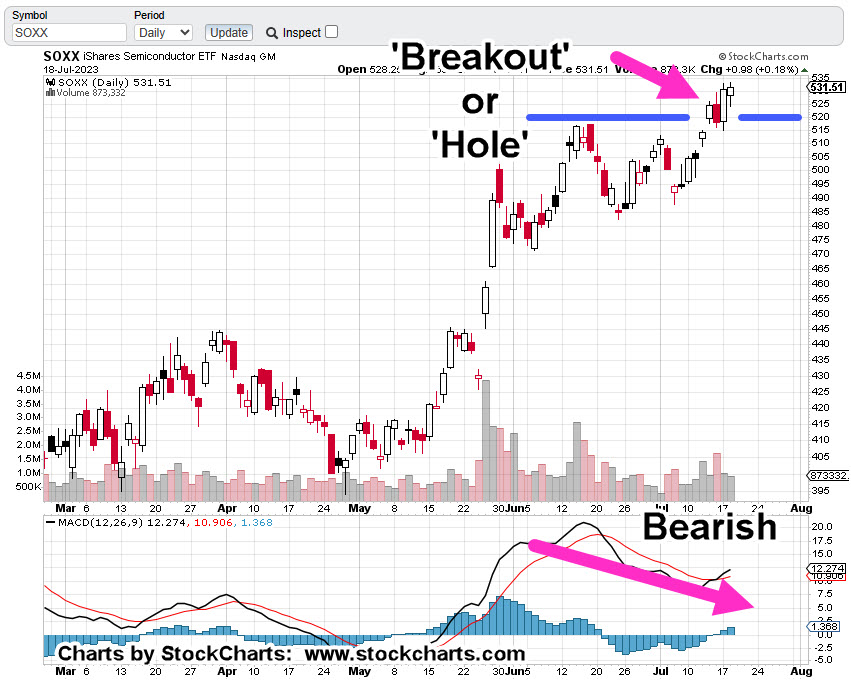
A tick lower in MACD, confirms the bearish divergence.
Then, there’s Fibonacci
Enter, The Count
When markets are in a mania, reaching insane extremes, it allows for a (more) clean print of either Fibonacci retrace levels or time correlation.

Decide for yourself if that’s the case now.
Remember, tomorrow (Wednesday) is the 19th, and one day before Taiwan (TSM) releases earnings.
That release is scheduled for the 20th before the open.
Stay Tuned
Charts by StockCharts
Note: Posts on this site are for education purposes only. They provide one firm’s insight on the markets. Not investment advice. See additional disclaimer here.
The Danger Point®, trade mark: No. 6,505,279

Pingback: The Last of The Bubble(s) « The Danger Point®