The Pattern (About) To Repeat

Of course, there’s no guarantee, biotech is going to repeat a repeating pattern; ‘spring-to-up-thrust’, but it looks probable.
We’ll start first, with the unmarked chart of biotech XBI.
Looking at the past month or so of trading activity, the eye should be drawn immediately to the potential.
Biotech XBI, Daily
If it’s a little vague, the second chart shows the detail.

Now, for the mark-up
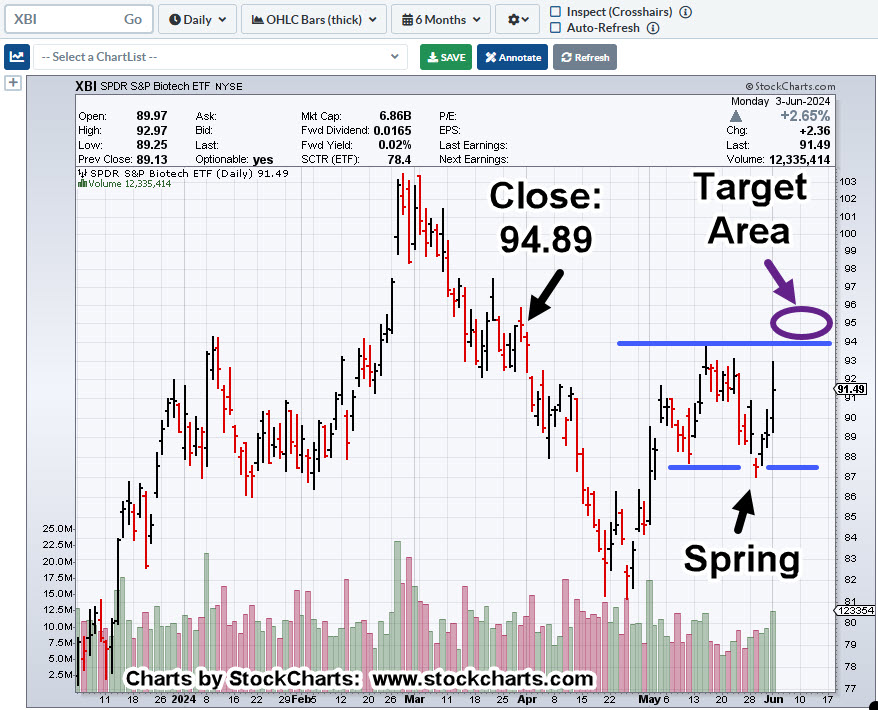
Not included on the charts, is MACD.
If price action gets to the up-thrust (target) area and stalls, daily MACD could post a bearish divergence.
Let’s not forget, this congestion action continues to build a downside count when considering Point & Figure.
Stay Tuned
Charts by StockCharts
Note: Posts on this site are for education purposes only. They provide one firm’s insight on the markets. Not investment advice. See additional disclaimer here.
The Danger Point®, trade mark: No. 6,505,279

Awesome writeup on XBI Paul! I made a great trade on it when it reversed down while back, waiting for it once again to get to the “edges” as David W. says! BTW just had a great 1 day trade on SOXS Monday – bought on the SOXX gap up at open (made my stop even better R/R wise!) watched it immediately go in my favor and sold end of day for a nice 6 % gain.
Richie
LikeLike
Pingback: Biotech … Hits Target « The Danger Point®
Pingback: After The Close « The Danger Point®