Bottled Air

Is this a new sequel to the Dickens classic?
Or is it a nightmare about to potentially unfold in a market (IYR), bloated and stretched on ‘expectations’ of lower rates.
Let’s go with the nightmare scenario and see if the charts support the premise.
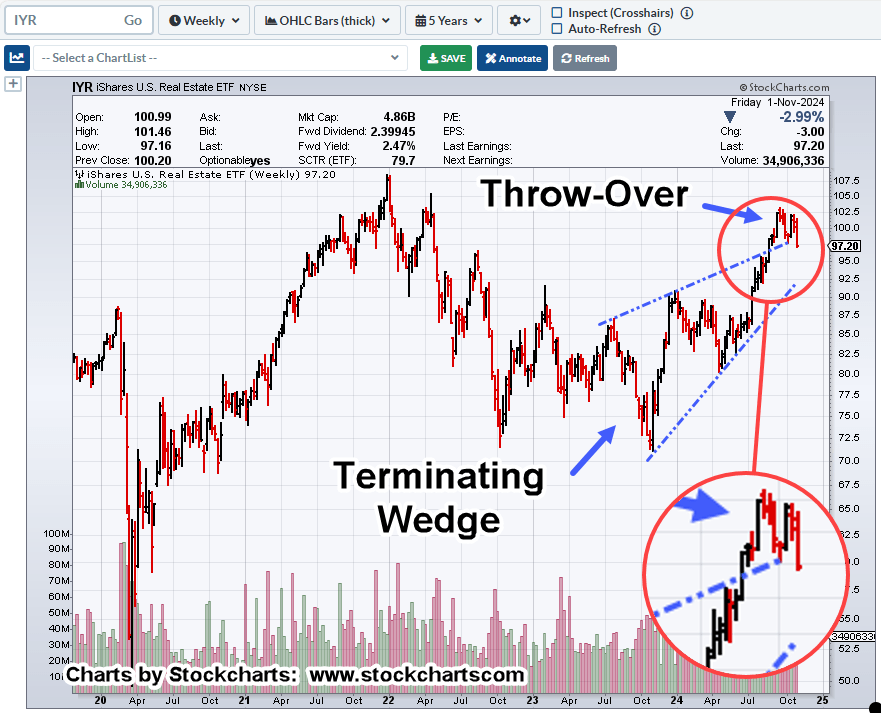
A while back, this update, it showed price action in a potential ‘throw-over’ of a terminating wedge.
What’s happened since then.
Real Estate IYR, Weekly
If it’s a ‘throw-over’, the past week’s action has entered back into the range; a classical analysis sell signal (not advice, not a recommendation).
Looking at the chart from a contrary (bullish) perspective, price action could be in a flag, ready to move higher.
Technically speaking, action finished the week below the lows of weekending, October 11th; a Wyckoff Spring condition.
With that, a ‘blip’ higher is to be expected in the coming sessions; the question is, if it moves higher, will it fail?
Stay Tuned
Charts by StockCharts
Note: Posts on this site are for education purposes only. They provide one firm’s insight on the markets. Not investment advice. See additional disclaimer here.
The Danger Point®, trade mark: No. 6,505,279
