More Fibonacci Correlations

The sector index SPBIO, is shown in the chart below.
Although there’s no volume data, there isn’t any ‘transaction slippage’, or ‘management fee’ skew errors either.
As of this update (1:03, p.m., EST) the SPBIO (XBI) is trying its best to post a new daily high … attempting to grind its way higher.
For now, it’s not happening.
Biotech SPBIO, Daily
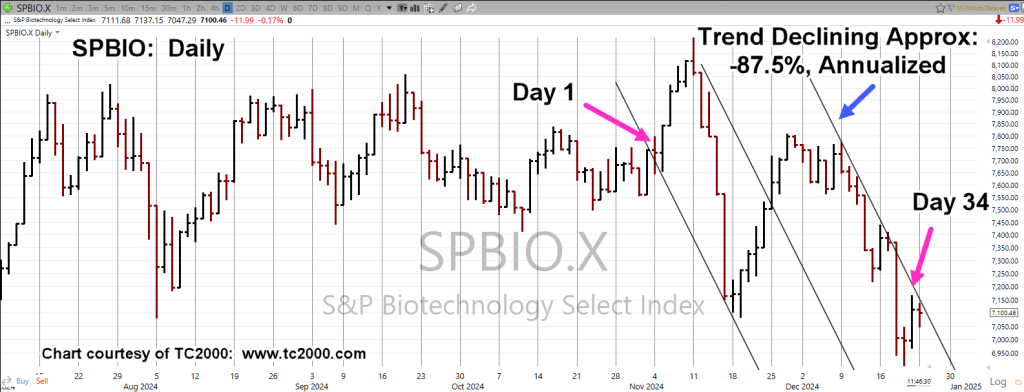
The channel shown, discussed in this update.
Not presented at that time, the apparent Fibonacci count from the left-most channel contact to the latest daily high contact (Friday).
From a trading perspective, from a position of being short this market (LABD-24-21), there’s no specific indication to exit the position (not advice, not a recommendation).
Stay Tuned
Charts by StockCharts
Note: Posts on this site are for education purposes only. They provide one firm’s insight on the markets. Not investment advice. See additional disclaimer here.
The Danger Point®, trade mark: No. 6,505,279

Pingback: Biotech Hits The ‘Numbers’ « The Danger Point®