Where The Stops, Are Hiding

Let’s say, you’re a big player in the markets, with deep pockets.
Your timeframe is medium, to long-term, months-to-years.
If you were short biotech XBI, where are your stops?
That’s what we’ll look for, in the chart below.
Biotech XBI, Weekly
The un-marked chart, first.
Where does the eye go to (naturally) as a ‘safe’ location for stops on a short position?
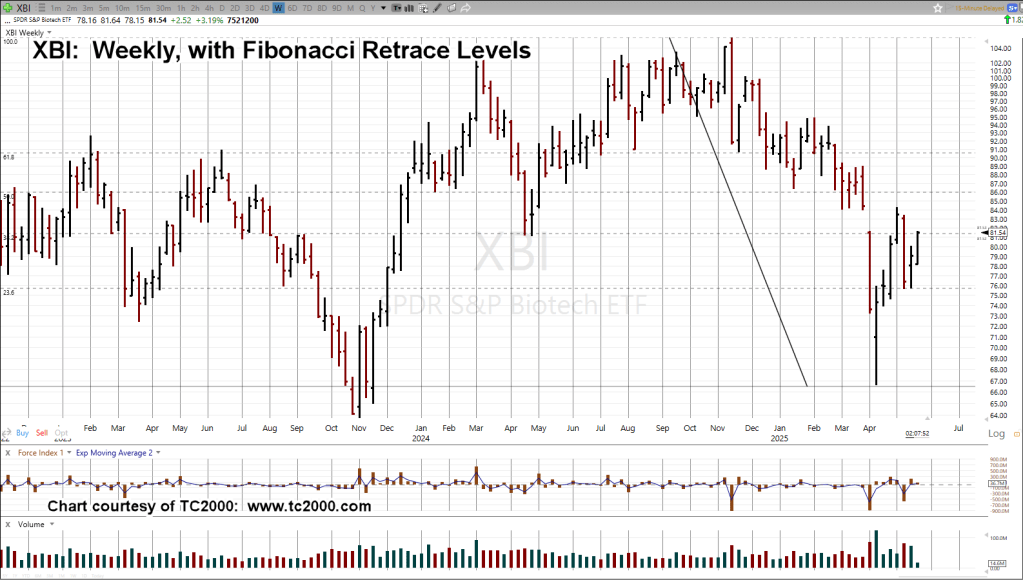
Now, for where the stops may be hiding … and of course where we want to wait for a short (entry) opportunity.

The location shown is just below the 61.8%, retrace level and price action congestion.
Let’s see what happens next.
Stay Tuned
Charts by StockCharts
Note: Posts on this site are for education purposes only. They provide one firm’s insight on the markets. Not investment advice. See additional disclaimer here.
The Danger Point®, trade mark: No. 6,505,279
