Terminating Wedge

It could be a slow grind, a series of ‘air-pockets’, or of course, not at all.
Using time-tested classical analysis, along with a dash of Elliott Wave, shows us we just had a terminating wedge ‘throw-over‘.
The video in the attached link, is brief and concise.
Throw-overs are (typically) major reversal indicators (not advice, not a recommendation).
As of yesterday, Friday, that’s where we are.
Nvidia NVDA, Daily Close
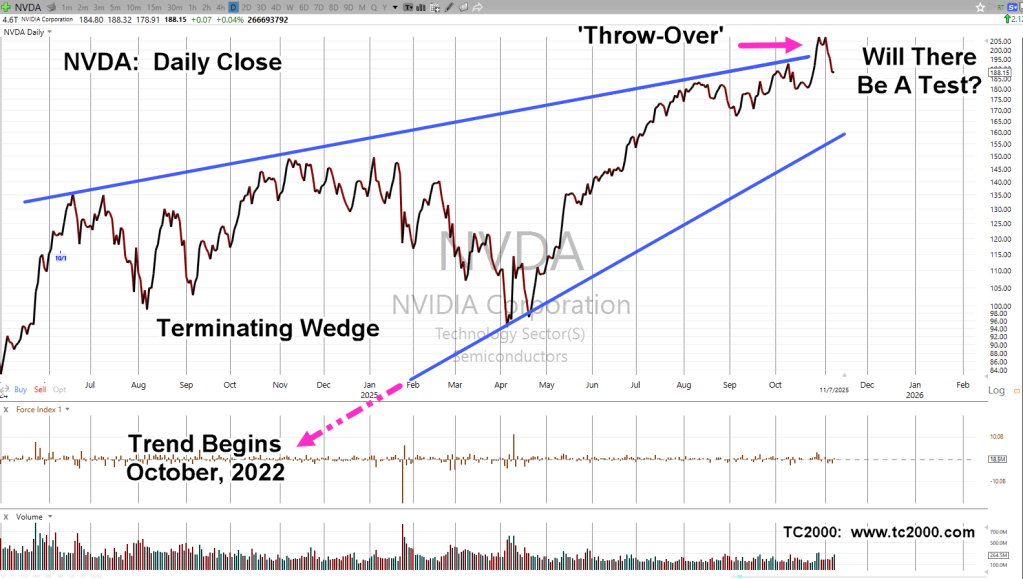
As seen with Nvidia, literally anything can happen. It could somehow recover, go sideways, or collapse.
If price action gets to the lower wedge, then breaks down, the ‘measured move’ for such a break, is -80%, to -90%, lower (not advice, not a recommendation).
Crash in The Past
The crash of 1899, shows us that just because we got past October without fanfare, a crash can happen at any time.
A prior update, written three-years ago, describes that crash, link here.
Stay Tuned
Charts by StockCharts
Note: Posts on this site are for education purposes only. They provide one firm’s insight on the markets. Not investment advice. See additional disclaimer here.
The Danger Point®, trade mark: No. 6,505,279

Pingback: Nvidia’s Test & Reversal « The Danger Point®