Repeating Characteristics

Yesterday, biotech XBI was down on the most volume since May 6th, of this year.
For leveraged inverse fund LABD, it posted the heaviest upside volume, ever.
The chart shows a (potential) repeating characteristic for XBI that occurs at the point of trend change (not advice, not a recommendation).
As always, anything can happen and today’s ‘test’ could fail with XBI continuing higher.
Biotech XBI, Daily Close
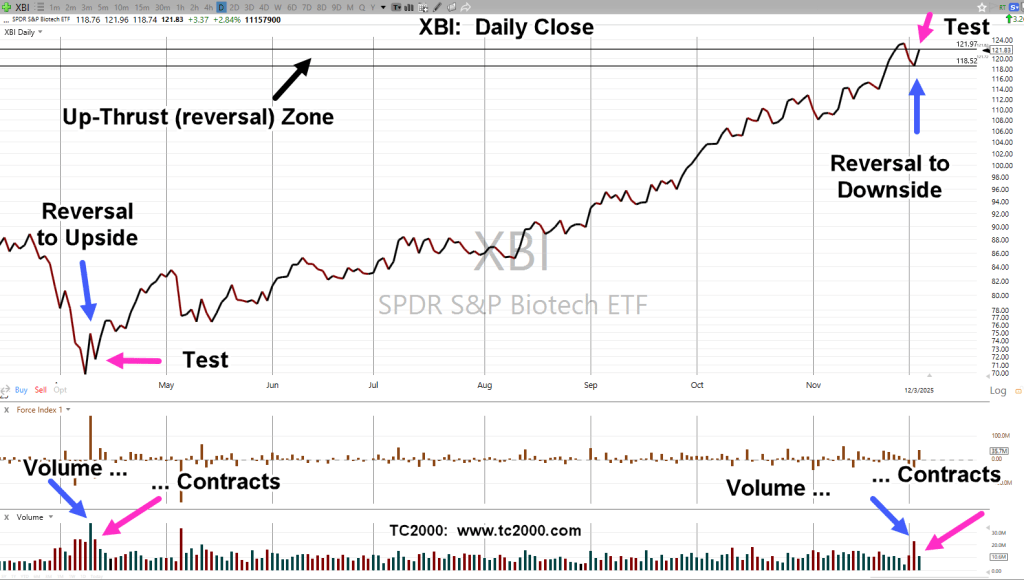
The ‘up-thrust’ reversal zone is between support/resistance areas (far left, off chart) at the approximate location of the 50% retrace.
Stay Tuned
Charts by StockCharts
Note: Posts on this site are for education purposes only. They provide one firm’s insight on the markets. Not investment advice. See additional disclaimer here.
The Danger Point®, trade mark: No. 6,505,279

Pingback: Biotech, Hangs at The Wedge « The Danger Point®
Pingback: Anatomy of a Reversal « The Danger Point®