Tesla … Reversal Target … $260

Short Squeeze Continues

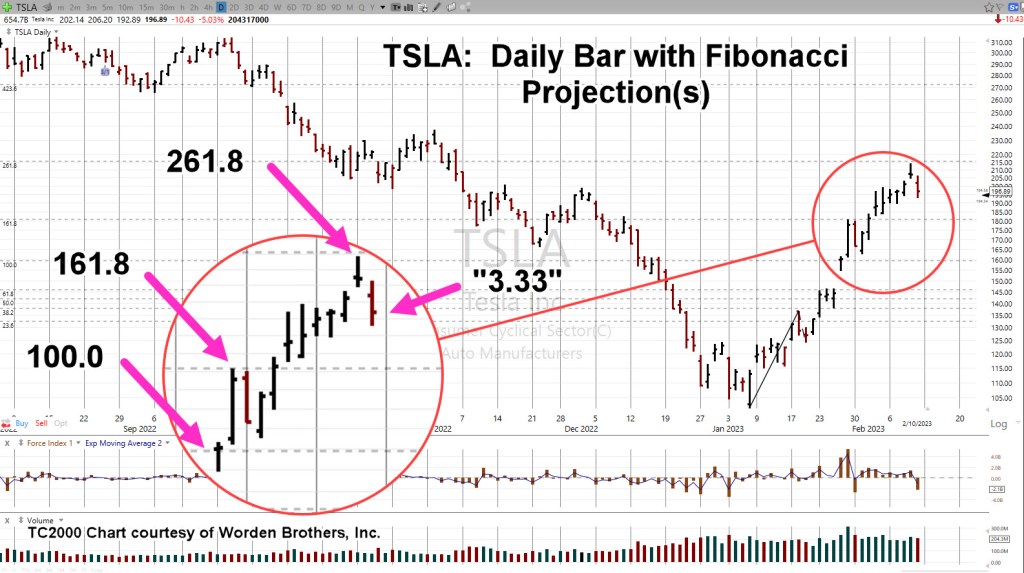
Unless we reverse right here and now, Fibonacci retrace and projections (shown below) target the $260 – level for TSLA.

If you know what’s (potentially) coming, you can get ready.

The ‘Ponzi’ case for Tesla has already been established with this prior link, here. Of special note in that link, are the production percentages for General Motors.

Didn’t we just see another ’66’, at this link?

With all of that, let’s go out on a limb and project TSLA might top at 266, instead of the Fibonacci projected 260 (not advice, not a recommendation).

Tesla TSLA, Daily

The daily chart is compressed to show the entire down-wave and retrace from the November 4th, 2021, high.

Three retrace levels are shown (magenta); first is 23.6%, then 38.2% and labeled retrace of 50%, near the 259-level.

Moving closer-in, and including Fibonacci wave projection, while keeping the retrace levels, yields the following.

The chart’s a little bit busy but one gets the idea.

There’s a Fibonacci overlap of retrace and projection near the 259-260, level.

What’s another 6-points between friends to get to 266?

Next Steps

Of course, anything can happen and TSLA, could reverse to the downside on Monday.

However, if it continues higher, we’ll be monitoring for potential confirmation of the target and subsequent reversal (not advice, not a recommendation).

Stay Tuned

Charts by StockCharts

Note:  Posts on this site are for education purposes only.  They provide one firm’s insight on the markets.  Not investment advice.  See additional disclaimer here.

The Danger Point®, trade mark: No. 6,505,279

Tesla Top, and Fibonacci

Options Day-Trade, Nets … 170%

It’s no secret that Tesla’s a Ponzi scheme mania.

Its current market capitalization is over ten-times that of General Motors (GM); a company that’s been in business, since 1908.

GM’s auto production numbers for 2022, were 66% higher (imagine that), than Tesla’s 1.37-million; provided, that we actually believe any of the data. 🙂

If we take Tesla’s market cap as of Friday’s close (654.7bln) and divide it by the closing price of 196.89, we get 3.33.

You can’t make this stuff up.

The TSLA market has ultra-high liquidity and is highly emotional (like the gold market). That liquidity lends itself to Fibonacci-based analysis.

We’ll get to the analysis but first, the options trade.

Tesla TSLA, Option Trade: 3-minute Chart

We’re trading the day of expiration 2/10, and the value is decaying rapidly. The entry of 0.50 was about where the option closed on the prior session.

Note, the entry was made on the way up … extremely difficult to stomach selling short, on an expiring position, as the price is rising.

Option was closed when it was obvious there was no more downside for the day. Since it was a 195.0 Put, it expired worthless at the end of the session.

Now, on to Fibonacci.

Tesla TSLA, Daily, with Fibonacci Projection(s)

The chart shows how precise the moves have conformed to Fibonacci.

We’ve included the “3.33”, as mentioned above; it will be interesting to see what happens at the next open.

After-hours activity was down – 2.31 pts, on 2,486,196 shares, according to BigCharts.

Depending on subsequent price action, the next update will address the Fibonacci downside projections.

Stay Tuned

Charts by StockCharts

Note:  Posts on this site are for education purposes only.  They provide one firm’s insight on the markets.  Not investment advice.  See additional disclaimer here.

The Danger Point®, trade mark: No. 6,505,279