The entire precious metals sector may be about to take an unexpected hit.

Prior updates have discussed the Newmont (NEM) bearish divergence and reversal. This update shows a rising wedge breakout to the downside.
Using standard analysis techniques on the chart below, we get a measured move to the vicinity of 47 for NEM.
A decline of that magnitude, a drop of over 22%, may be the catalyst for a whole other bearish scenario.
Just based on empirical observation and analysis generally available (YouTube, et al), it’s pretty safe to say that no-one is prepared for a significant decline.
Well, almost no-one. As reported back in late September, the only YouTube analyst (that was located) proposing the idea of a decline was Sajad, in this report.
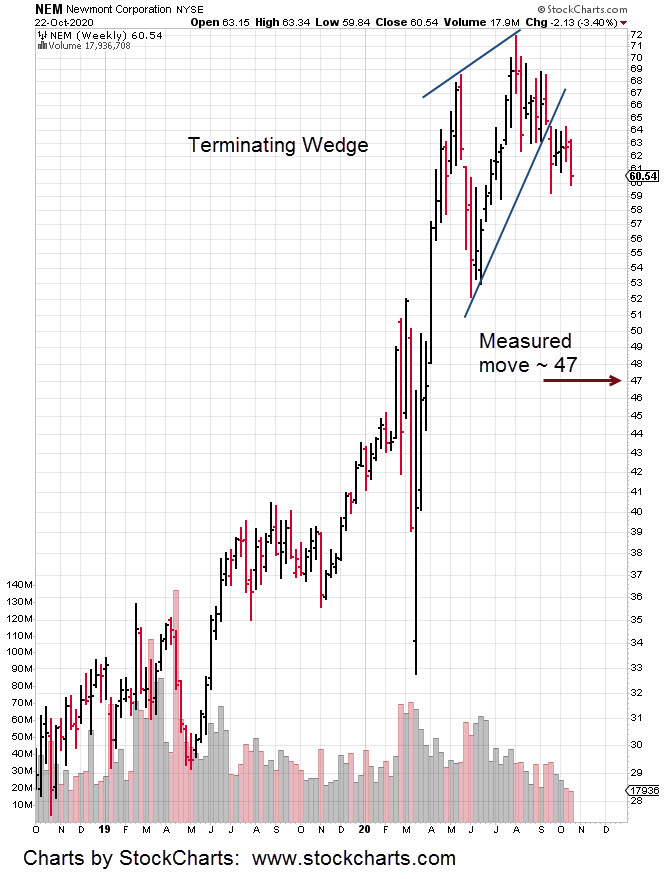
Charts by StockCharts
