Newmont Mining (NEM) is the heavy hitter.
Newmont’s in the Senior Mining Sector GDX with a market cap that’s equal to the next six mining operations combined.
If Newmont has reversed, the entire sector is likely to follow suit.
At this juncture, that’s exactly what’s happened.
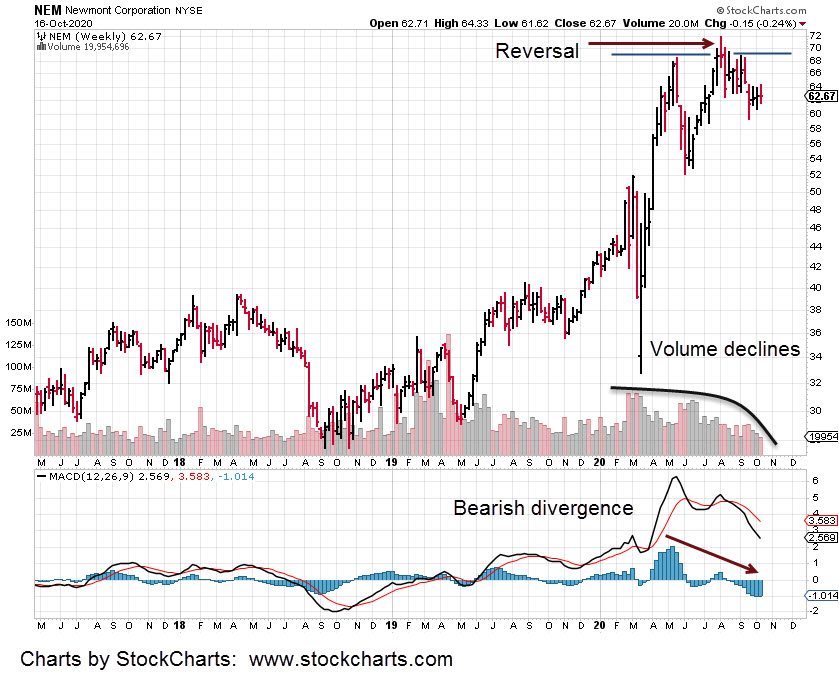
The chart below shows a weekly MACD bearish reversal in-effect. In-effect means the technical indication is correlating with the price action result.
Newmont appears to have made its high and is now heading lower.
Of course, the gold miners reversing and heading lower is completely opposite the established narrative.
Price is always the leader. Price action in NEM has probabilities pointed to the downside.
So, how will we know if the direction changes and resumes an up-ward course? What price level must be reached to negate the current reversal scenario?
Since we’re right at the edge, the danger point, small fluctuations change the outlook significantly.
Recall in a prior update, the quote from Wyckoff that effectively said:
‘At pivot points, price action can go either way. It’s as if the weight of a feather can determine the next likely direction.’
That’s where NEM is now. Price action is tight. The picture changes to the upside if we get a push above last week’s high: NEM, 64.33.
That’s just 1.66, points, or a 2.65% move from were NEM closed last Friday.
Charts by StockCharts

Pingback: Lying In Wait « The Danger Point
Pingback: Fail: Gold Miner Indexes « The Danger Point
Pingback: Step by Step: Shorting GDXJ « The Danger Point
Pingback: Newmont: Wedge Breakout « The Danger Point