Early Session
S&P Bullish … Or Bearish?

This is how the S&P (SPY) looked before the open.
The blue lines show a small wedge pattern. Under bullish conditions, price action continues higher into a measured move; somewhere around SPY 449 – 450.
What we got at the open, is below:
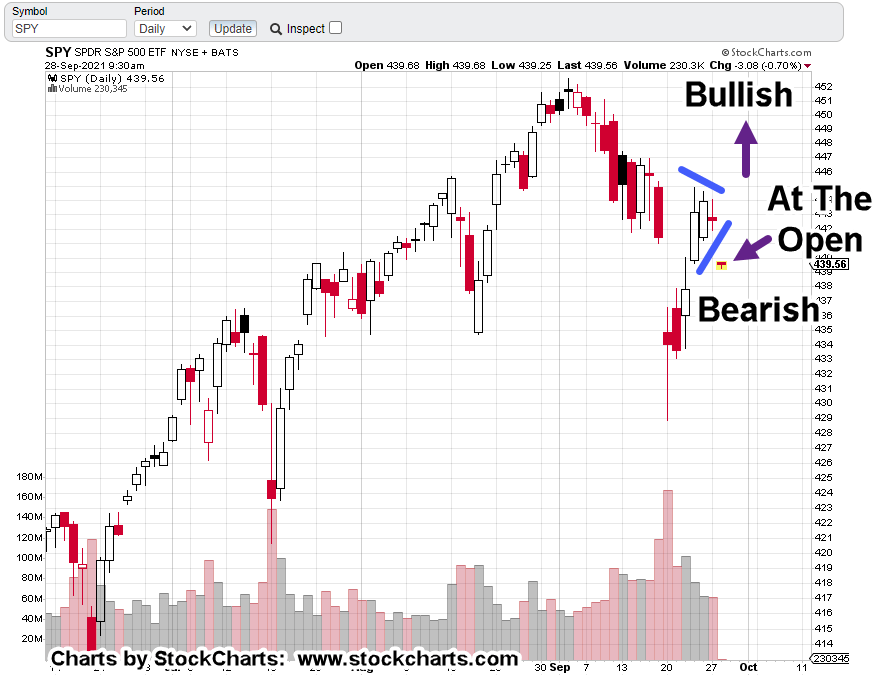
The SPY opened lower and so far, has not continued its upward momentum.
It may be nothing; or it may signal the Right Shoulder of the Head & Shoulders, is complete.
As always, anything can happen. SPY may be just gathering steam for an attempt at new daily highs.
However, the action in biotech indicates the bears are moving into the markets; behind the scenes and slowly at first.
Biotech, SPBIO:
Biotech has opened lower (LABD higher).
Yesterday’s price action was entirely consistent with the ‘alternation’ discussed in that update.
For Example:
There was no (immediate) downward test from the September 17th low … and this time, the September 23rd low, there was:
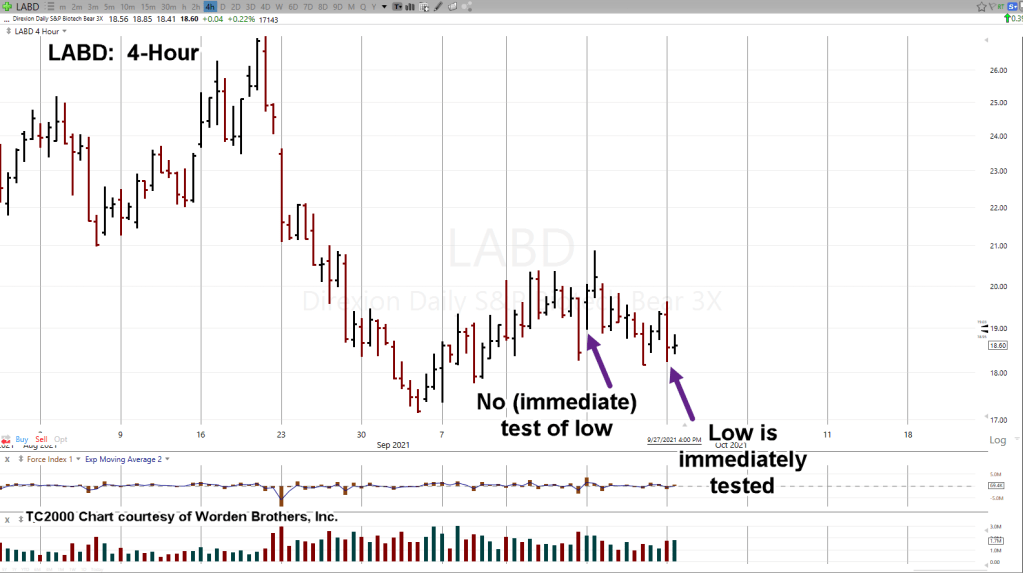
We can see, after the open, price action for LABD is pushing higher (lower for SPBIO):

If we get a new daily high for LABD (above yesterday’s 19.62), it signifies the lower testing action is likely complete; the bears are taking control of biotech.
Stay Tuned
Charts by StockCharts

Pingback: Elephant In The Room « The Danger Point®