Wait … What?
A major gold (miner) reversal?
Is that possible?
The last update on the subject highlighted a multi-decade Fibonacci time correlation.
Going all the way back to the 2001 lows for gold, there’s a correlation of 21-years, 89-weeks and 55-days as it relates to the Junior Mining Index, GDXJ.
This past Monday, 55-Days from the January 28th, low, GDXJ, posted a reversal.
The chart below, is an updated version of the one presented on Thursday, the 14th.
Junior Miners, GDXJ, Daily
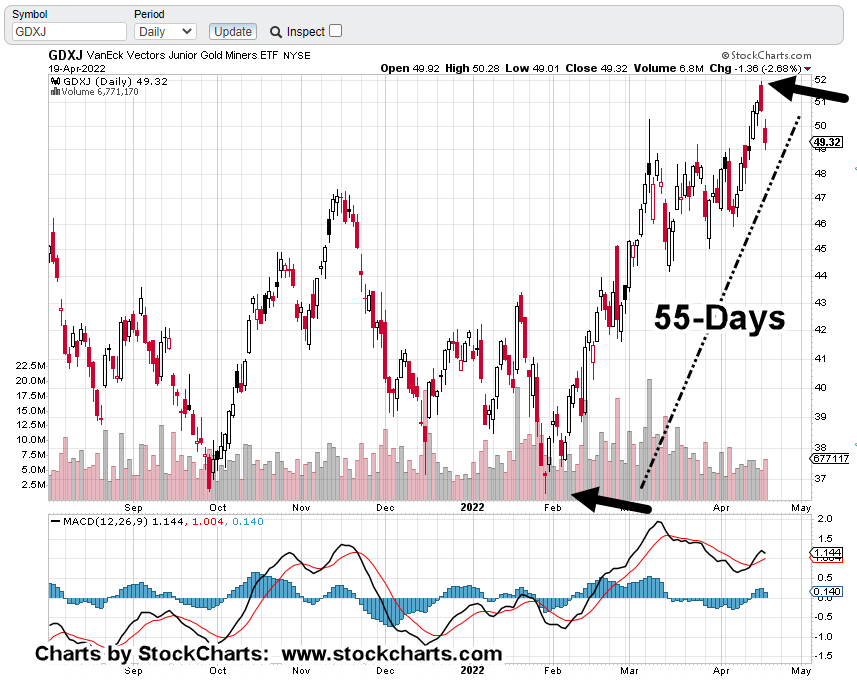
The bearish MACD has completed with a momentum tick to the downside. Price action reversed exactly at Fibonacci 55-Days.
Getting closer-in, the chart below shows we’re at minor support.
It’s early in today’s session about an hour after the open.
Price action’s already pushing down on the support level, posting a new daily low.

If GDXJ continues lower and decisively penetrates support, the expectation is for some kind of upward test in the next session(s).
For the Junior Gold Miners, GDXJ, we’re at the danger point.
Obvious stop levels for a short position would be yesterday’s high or Monday’s high (not advice not a recommendation).
Summary
With so many convinced gold and the miners must move higher as a result of ‘inflation’, a significant, sustained reversal would be completely unexpected.
Of course, what’s not being discussed (except in alternate media) is the intentional destruction of the food supply and the supply chain.
That’s at least a significant contributor to the rising prices.
Stay Tuned
Charts by StockCharts
Note: Posts on this site are for education purposes only. They provide one firm’s insight on the markets. Not investment advice. See additional disclaimer here.
The Danger Point®, trade mark: No. 6,505,279

Pingback: Gold … After The Reversal « The Danger Point®
Pingback: Miner Reversal … 7-Weeks Later « The Danger Point®
Pingback: Newmont Mining’s Collapse « The Danger Point®
Pingback: There’s No … ‘Santa Rally’ « The Danger Point®