Closer Look At Real Estate

No sooner than yesterday’s report was released, IYR price action broke upward through its down trendline.
However, the action remained weak with successive attempts to move higher being thwarted.
The sector closed down for the day.
That’s the way of the markets … set ups materialize, come to fruition or fade away.
It’s 20-minutes, before the open; IYR shows higher action.
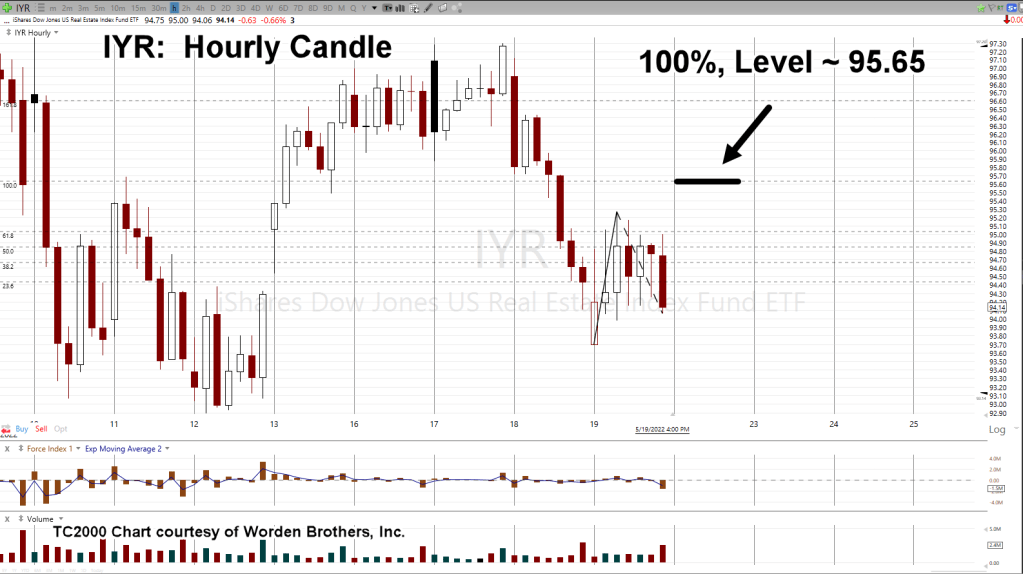
Based on the bid/ask spreads, we can see on the hourly chart below, action may be about to complete an ‘a-b-c’ corrective move.
Real Estate, IYR Hourly Chart
The area of interest is identified by the magenta circle.
The second chart shows that action with the Fibonacci projection.

Closer-in with Fibonacci ‘a-b-c’ projection
Recall, the rule of alternation says, ‘last time is not this time’.
Price action from yesterday’s session was choppy and overlapping. Today looks to open sharp gap-higher and thus, fulfills the ‘alternation’.
Summary
Obviously, it’s what happens after the open, that’s important.
A swift retrace/reversal and posting an hourly down bar would point probabilities to continued downside for the day.
If we get upward buoyancy instead, we may be in for a protracted upward test.
The hard-stop for the current DRV-22-02, position is unchanged at DRV 45.64 (not advice, not a recommendation).
Stay Tuned
Charts by StockCharts
Note: Posts on this site are for education purposes only. They provide one firm’s insight on the markets. Not investment advice. See additional disclaimer here.
The Danger Point®, trade mark: No. 6,505,279
