It’s possible, because price action is always the final arbiter.
Before the rest of the report, some housekeeping.
Real Estate IYR, has broken the down trend lines previously discussed.
A discretionary (not stop related) exit was performed on all positions at approximately DRV 46.45.
Trade DRV-22-02, is officially closed.
If the market turns around and looks like IYR is about to resume its downtrend, the DRV position could be re-established (not advice, not a recommendation).
As it stands, profit on the entire DRV-22-02, was in the vicinity of +19.2%.
That’s not too bad, considering the rest of the population is losing their shirts as reported here.
There were 25 DRV, transactions during the trade.
Where to Now?
Real estate can resume the downtrend, or it can test the underside of support, now resistance (shown below).
Under ‘normal’ market conditions, a test is typical behavior.
However, we’re in a financial collapse so anything is possible.
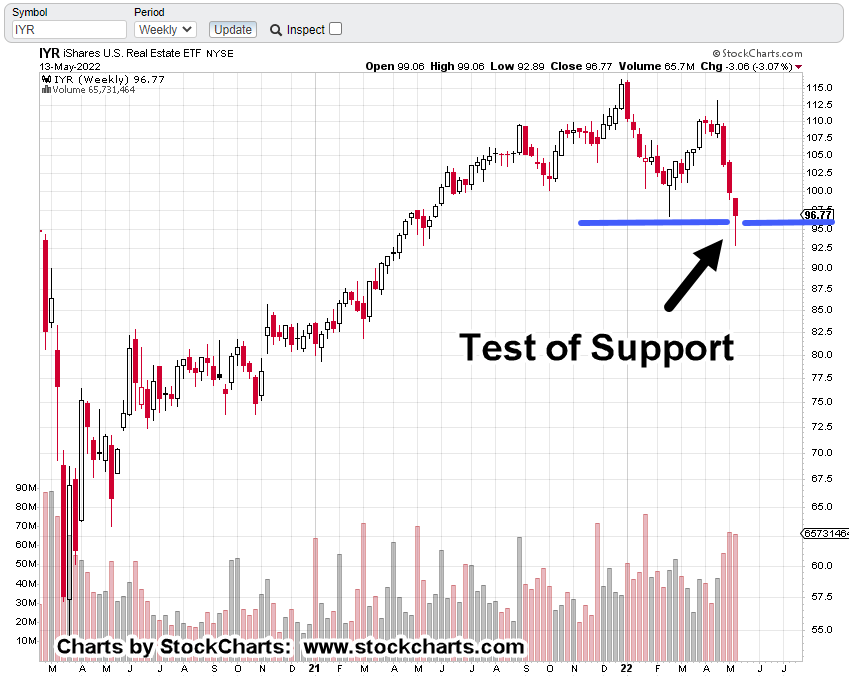
Real Estate IYR, Weekly
The chart above paints a familiar picture.
The overall trend is down. However, that does not mean price can’t go higher.
In fact, as we all know, the sharpest rallies occur in the middle of bear markets.
Whether we get one now, is unknown. Typical market behavior is to come back to the resistance area (black axis line) for a test.
Summary
From personal standpoint, I’ll take the near 20% gain (not advice, not a recommendation) and stand on the sidelines for a more definitive set-up.
Note: Posts on this site are for education purposes only. They provide one firm’s insight on the markets. Not investment advice. See additional disclaimer here.
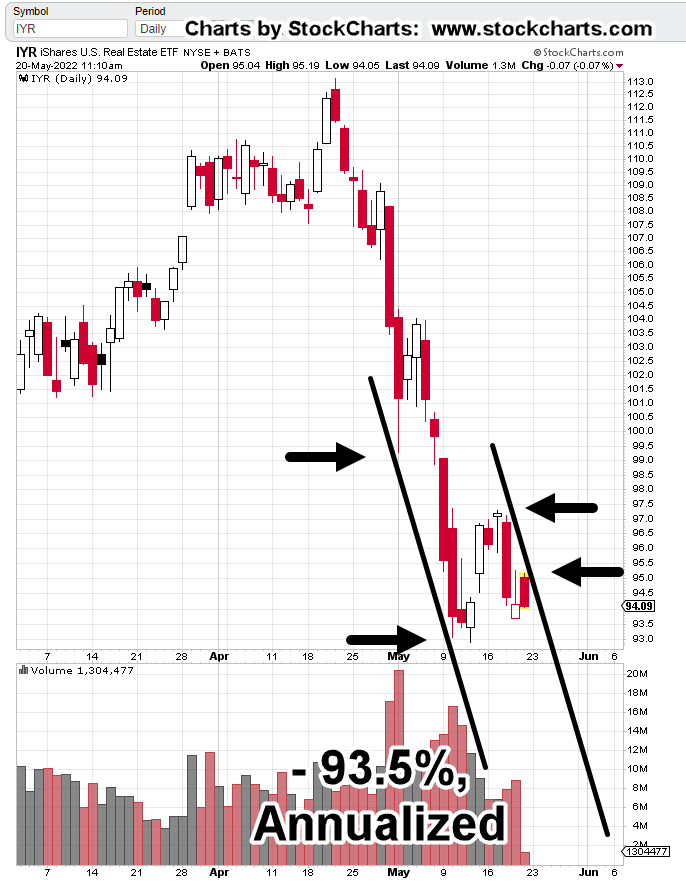
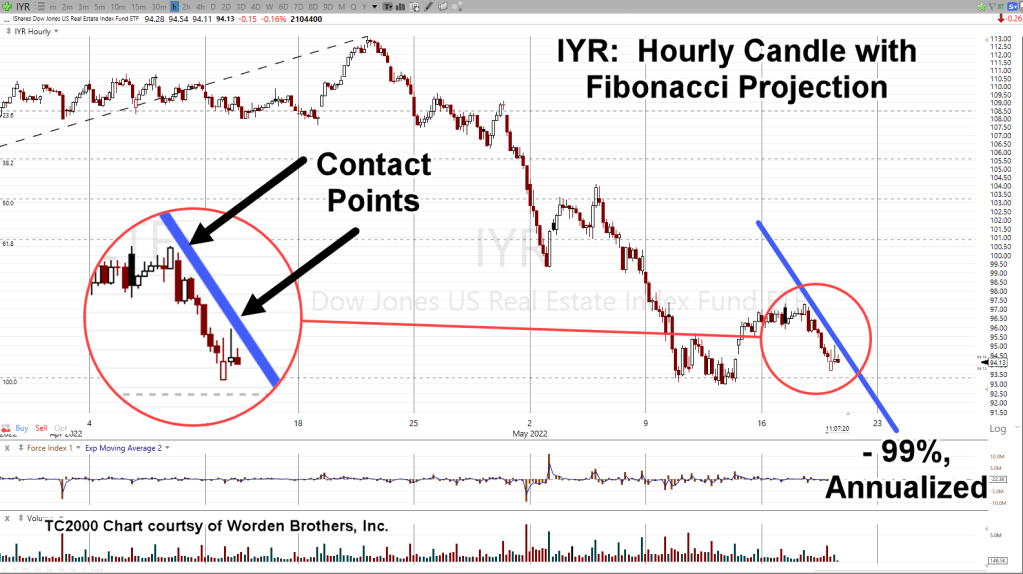
Does it really matter if IYR’s channel is at -99%, or -93.5%?
The sector’s going down fast; that’s the important part.
Unless there’s some kind of decisive, high-volume break to the upside, we’ve got IYR in a confirmed trading channel, declining at approximately – 93.5%, on an annualized basis.
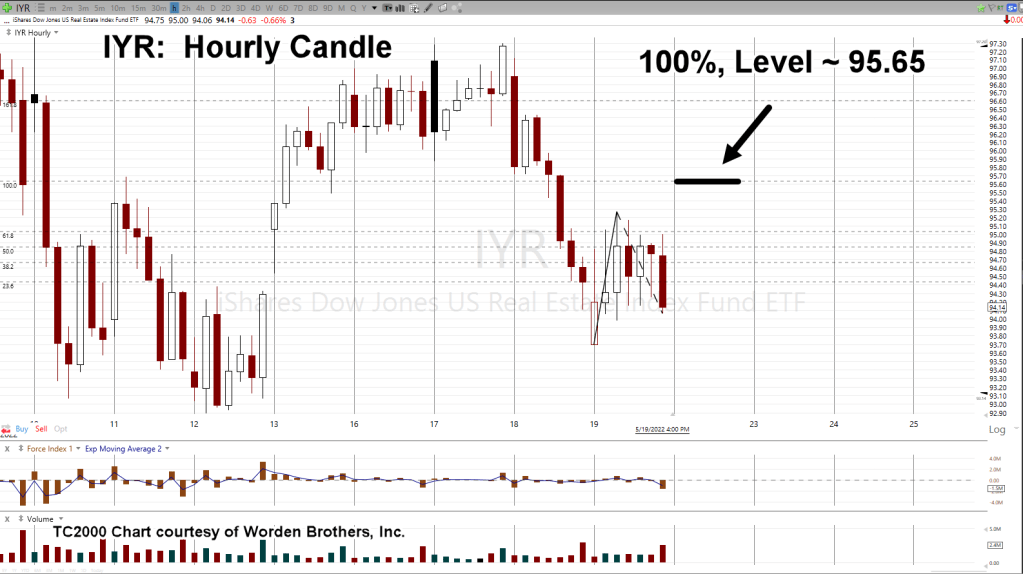
The morning gap open in IYR, was higher as expected; sated in the pre-market report.
However, instead of reaching the 100%, ‘a-b-c’ target, where wave ‘a’ would be equal to wave ‘c’ (a common occurrence), the gap higher only reached a 61.8% target: indicating significant weakness.
The daily chart, has the situation as of 11:30 a.m., EST
Real Estate IYR, Daily
One thing that’s not happened yet … there is no new daily low for IYR.
It has not posted below yesterday’s low of 93.70.
That’s about the only factor that remains as potential upside for the sector.
If yesterday’s low is penetrated, then it weights probability significantly to the downside (not advice, not a recommendation).
Note: Posts on this site are for education purposes only. They provide one firm’s insight on the markets. Not investment advice. See additional disclaimer here.
Note: Posts on this site are for education purposes only. They provide one firm’s insight on the markets. Not investment advice. See additional disclaimer here.
It’s still early in the session and it looks like real estate’s in serious trouble.
A change of events putting IYR declining at – 99%, annualized.
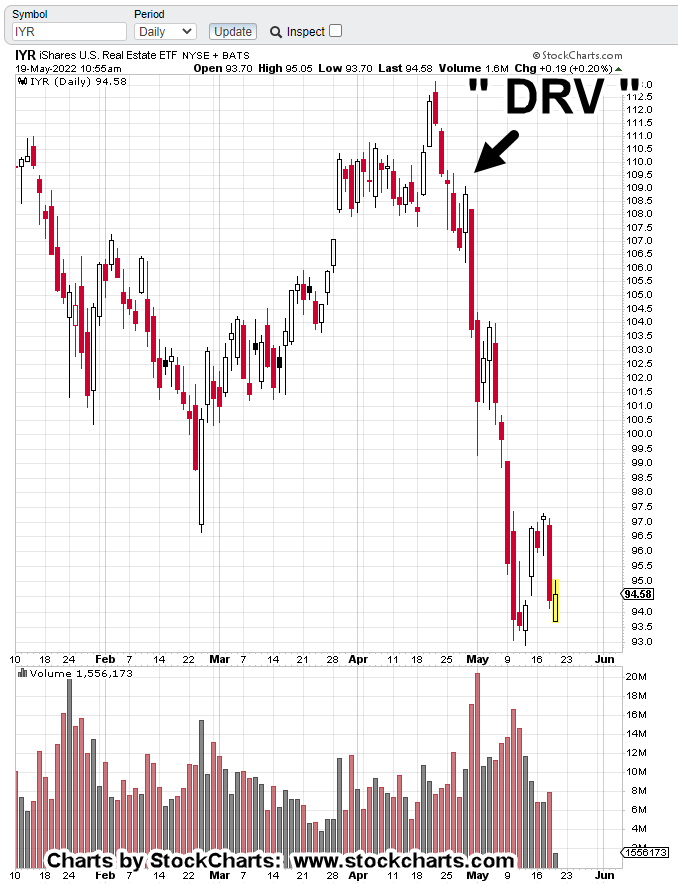
Several charts of real estate IYR, are presented below; not the least of which is the location of the first ‘DRV’ (3X inverse, IYR), entry.
Strategy, Tactics and Focus are the three tenets laid out by Livermore, Wyckoff and Loeb respectively.
Strategy: The real estate sector is ‘finished’ for this bubble go-round. Look for significant medium to long term trading (position) opportunities.
Tactics: Use Wyckoff analysis to identify the exact location where risk is least; The Danger Point
Focus: Significant trading opportunities are rare. When one is found, it must be used to its fullest extent.
This site presents the method above, in real-time.
The first chart of IYR shows the location of the initial DRV entry (not advice, not a recommendation).
Real Estate IYR, Daily
Positioning short this sector has been fully documented here and here.
As a result of yesterday’s action, also anticipated and documented here, the sector may have pivoted into a sharper trend; a trend declining at – 99%, annualized.
Is that a hyperbolic statement? Not if it happens.
As this post is being created, we’re going to look at the hourly chart of IYR (below) and show that price action is struggling to stay away from that -99%, trendline.
IYR: Hourly Chart
We’re at the top of the hour (11:00 a.m., EST) and the hourly candle may have just confirmed the new trend.
Summary
As said many times on this site, when or if, a major break occurs, there will be no getting in or out (not advice, not a recommendation).
At this juncture, now fifteen minutes past the top of the hour, price action is still struggling.
If it continues lower, does not break the trendline and prints below last week’s low of 92.89, it’s a serious event; more confirmation of the new down-trend.
Note: Posts on this site are for education purposes only. They provide one firm’s insight on the markets. Not investment advice. See additional disclaimer here.
Is the objective to create as many news stories (fake or not), along with incessant and contradicting market analysis with the objective: Shut down and distract even the most disciplined trading professional?
The market’s going up, it’s going to crash, it’s in a short squeeze, Goldman ‘says’, then ‘says not’ and on it goes.
If memory serves, the propaganda during the 2007 – 2008 meltdown, wasn’t nearly this bad. Of course, that was before the Smith-Mundt act was repealed … but I, digress.
There are even a few unfortunate dolts that don’t’ even know anything’s happening at all.
Take a look at Dan’s (i-Allegedly) latest video here.
He talks about the number of people contacting him to say ‘it’s not that bad’, or ‘real estate’s going much higher’, or ‘whatever’ as Dan likes to say.
He does present from the (ethical) sales professionals a recognition, real estate’s ‘finished’ for this go-round.
Even while we get reports like this one, where sentiment is so bad, a rally is imminent, the trading objective must be to remain focused on the data … price bars and volume.
That’s what we’re going to do as outlined below.
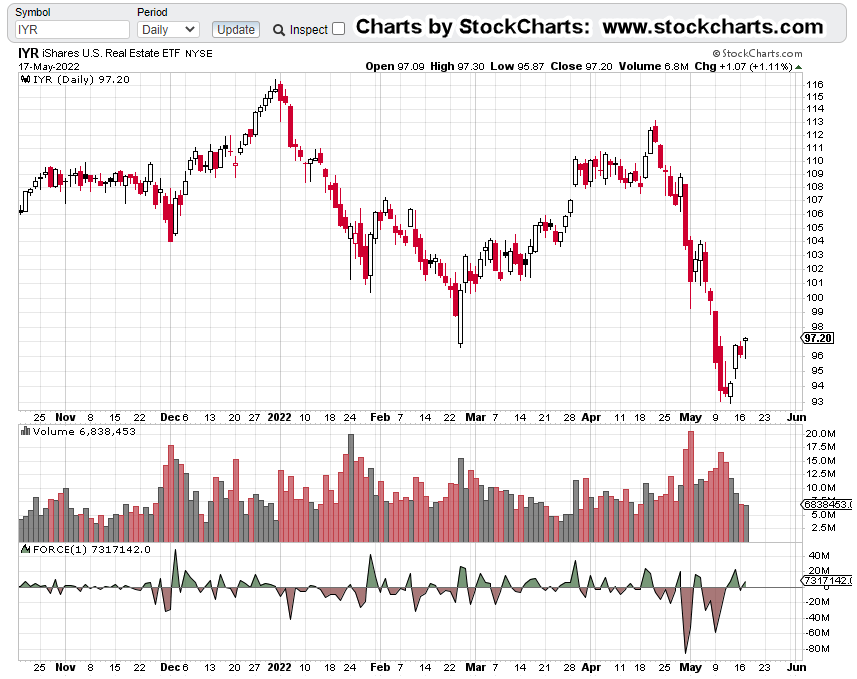
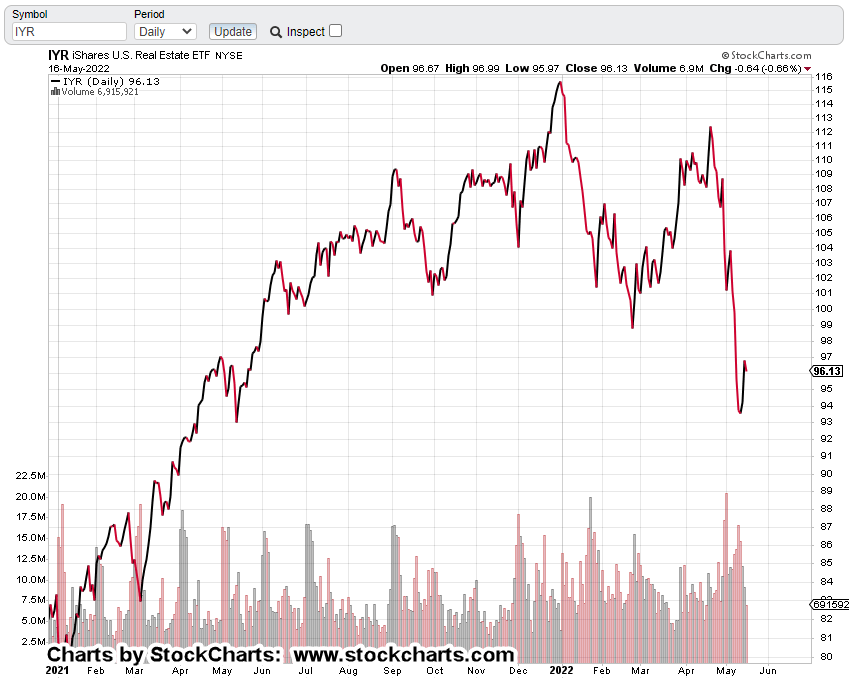
Real Estate IYR, Daily Chart
The un-marked chart.
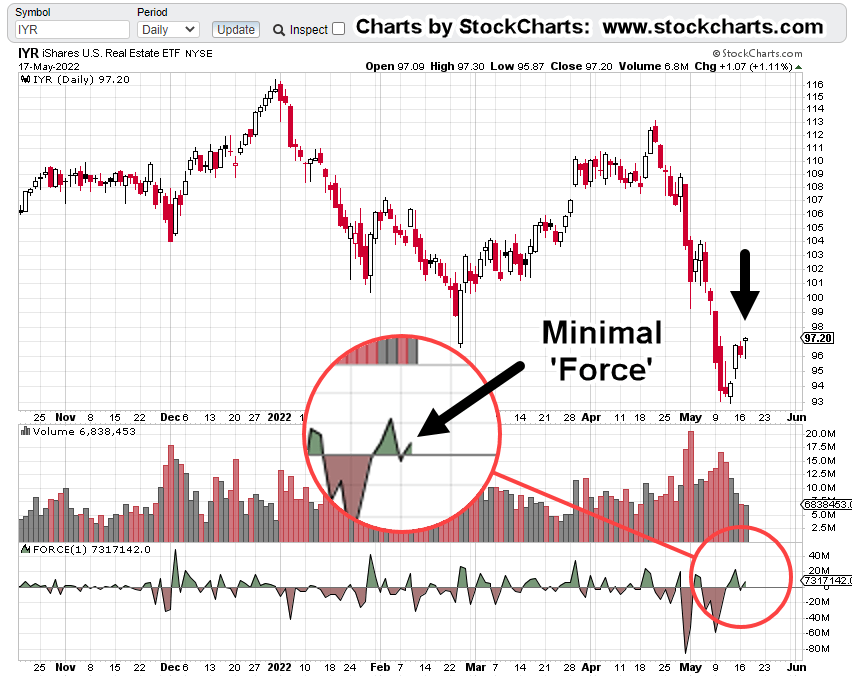
Now, let’s get to the ‘force’ behind the rebound of the past four trading days.
The tiny blip circled, was all there was for upward energy from yesterday’s move.
Price action inched up just over 1%.
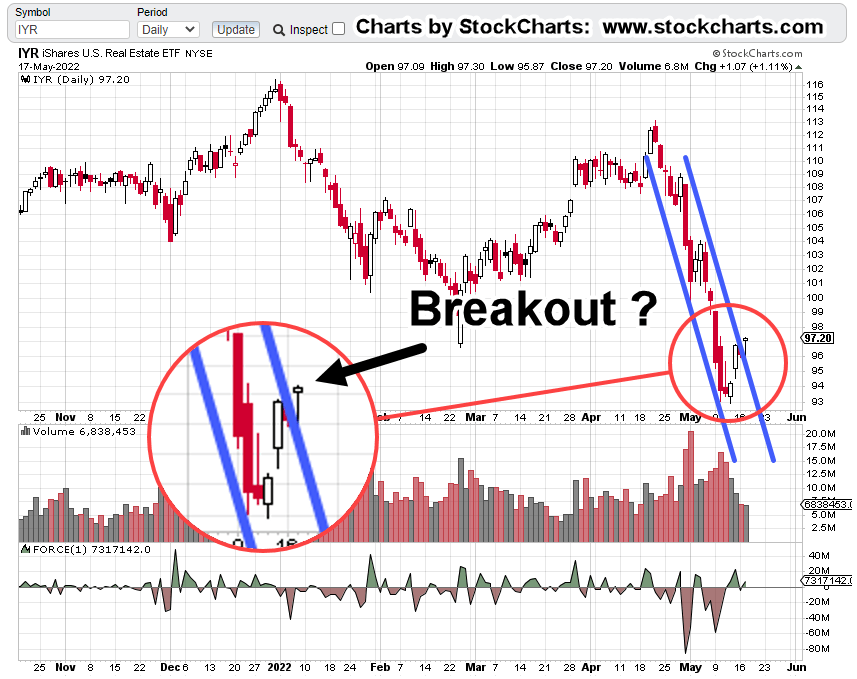
Looking at the situation from a trading channel standpoint, we see yesterday’s action got just outside the well-established trend lines.
So, we have a little ‘blip’ outside the trendline on minimal volume and force.
The news story linked above (repeated here) says a ‘short squeeze’ is imminent … at least for the tech stocks.
What about the rest of the market? Is real estate going to breakout as well?
That actual (IYR) data says, anything can happen; however, with such anemic upside performance, the expectation is for IYR, to resume its downward trend.
Positioning
It’s about forty-minutes before the open and we already have DRV, pre-market activity.
Because the (bid/ask) spreads are so wide in both IYR inverse funds SRS, and DRV, pre-market activity is rare.
Nonetheless, 3X inverse DRV, is trading higher at +0.79 points or +1.71%, indicating that IYR will have a lower open.
That means, the DRV low of yesterday (DRV 45.64) would make a good stop location for any positioning (not advice, not a recommendation).
Summary
Wyckoff analysis is independent of the news or the financials. He discovered as early as 1902, that prices are moving from a ‘force of their own’ having nothing to do with fundamentals.
The action itself will point to the next likely outcome.
Note: Posts on this site are for education purposes only. They provide one firm’s insight on the markets. Not investment advice. See additional disclaimer here.
It that’s the case, the first hour of trading will be the most important.
There are times, it’s rare, when a Head & Shoulders pattern will be violated, negated.
The most famous of those, was way back in 2002, when a clear H&S pattern showed the S&P was set for a major decline.
It didn’t happen. Price action ‘miraculously’ reversed; then went into another bubble in 2007 – 2008.
Years later, it was revealed it was the Fed (or those benefitting from them) that halted the H&S collapse and manipulated the market higher.
How much better for all of us, would it have been if the S&P had washed out in 2002.
Well, here we are with real estate IYR, in a similar position.
Real Estate IYR, Daily Chart
The chart has Fibonacci retrace included as well as the pre-market bid/ask spreads (noted by the orange arrows).
At this time (forty minutes before the open) IYR, shows gap-open higher; potentially into the 23.6%, retrace.
The First Hour
To maintain the short position via DRV (not advice, not a recommendation), I’m looking for a near immediate reversal of the gap-higher open (if it happens) … ideally, posting an hourly reversal bar.
Opening action like that (or similar) would indicate prices can’t be sustained at elevated levels and we’re likely to continue lower to the measured move from the last post.
Note: Posts on this site are for education purposes only. They provide one firm’s insight on the markets. Not investment advice. See additional disclaimer here.
Real estate’s in the … well, it’s in the outhouse; we’ll leave it at that.
Today was the day where IYR had the opportunity to build on any momentum gained over the last two trading sessions (Thursday, Friday).
Today, the index posted a new daily high within about fifteen minutes after the open.
Then, it spent the rest of the day trying to move higher.
Additional new highs weren’t happening; about a half-hour before the close, price action began to fall away.
That’s where we are now.
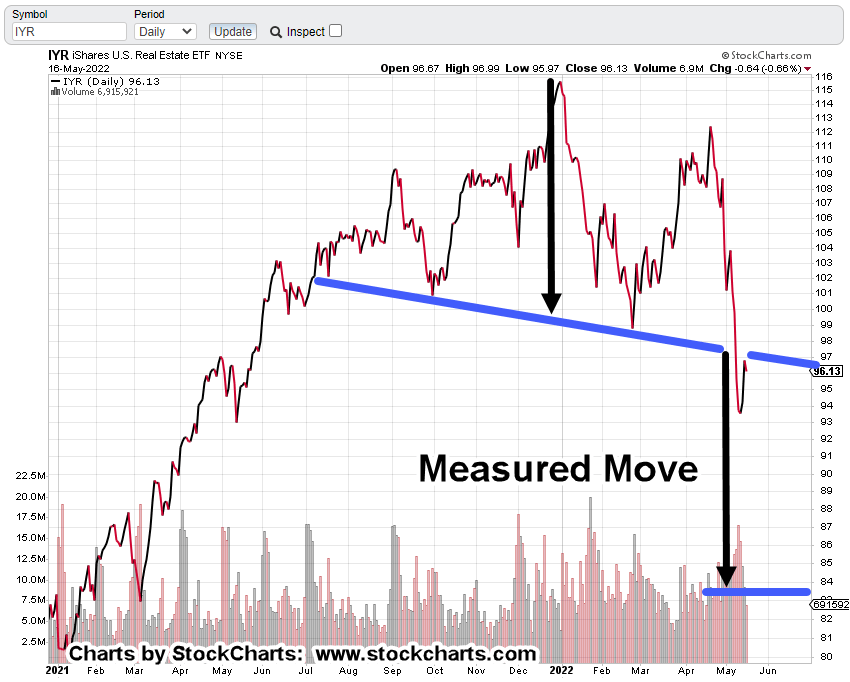
IYR Daily Close
The next chart makes the situation more clear.
There’s a Head & Shoulders top, a neckline, break of the neckline, test and reverse.
The fundamental pressures continue to build.
Interest rates remain elevated but even if they come down, it’s already in the works; buyers don’t qualify, layoffs are starting in earnest and it’s all unraveling … very, very fast.
This very same scenario has been played out in history; over and over, bubble after bubble.
We’re now in a multi-year, to multi-decade decline (if it ever recovers).
Measured Move
The chart above shows a measured move target in the area of 83.5, for IYR, providing that price action continues its decline.
The chart in the prior post, had a Fibonacci projection to the 80.5 area. So, the targets are similar.
Actually, this is what we want.
If we can use different analysis methods to come up with essentially the same target, it increases the probability of meeting that target (not advice, not a recommendation).
Positioning
The DRV position remains active; DRV-22-02.
If IYR posts a new daily high at tomorrow’s session, it points probabilities to either a protracted choppy test, or a rebound to higher levels; if either of those scenarios take place, the position will likely be exited.
Note: Posts on this site are for education purposes only. They provide one firm’s insight on the markets. Not investment advice. See additional disclaimer here.
If you’re blowing whatever’s left of your money (or credit), it’s likely you have no real marketable (high pay) skills, no talent, lazy, obese; so, we’re off to Vegas.
Add to that, we’rejust at the start of the depression.
Patera, from Appalachia’s Homestead (time stamp 4:24) addresses the problem a little differently but her final assessment is the same.
It’s true, there are some barriers to learning a new skill.
Dan from i-Allegedly points out the high cost to get a CDL, to be a trucker.
However, those who are awake, those with their nose in the KJV Bible, those leaving the corrupt church (in droves), knew that current events were coming; they took action way before it became obvious.
Yet another indicator of the current strange weather (warfare) that’s going to strain the system.
Here’s the link to the very first post that specifically referenced Genesis 41; posted on December 31, 2020.
As with the ‘Mask on, Mask off (linked above), how has the post aged?
Is it still relevant?
What about this quote … seemed extreme at the time.
They paid for the corn first, with gold and silver. Then they paid with their livestock. Then they paid by selling themselves into life-long slavery. We can equate that last part (slavery) as getting the vax.
No. 5
Chess Board Strategy
It’s a bitter pill to realize we’re in the long game. ‘Normal’, is not coming back … ever.
That does not mean there’re no opportunities. There are.
Those opportunities (if we survive) are/will be potentially life changing for the good.
The Sunday futures market opened about two hours ago and we’re up around +0.40%, in the S&P.
Let’s see if that spills over to the Monday open; remembering that we’re short the real estate sector with the finger on the sell trigger (not advice, not a recommendation).
Note: Posts on this site are for education purposes only. They provide one firm’s insight on the markets. Not investment advice. See additional disclaimer here.
How many times have you heard after a move is nearly over, the financial press will say:
“Well, the easy money has already been made”?
They kept everybody on the wrong side long enough for the professionals to reap a windfall; then act as if you should have known it all along.
Back in 1992, during the presidential election, I watched as a major financial publication put our report after report how the economy was contracting, getting worse.
Then, after the election was over and the incumbent ousted, that very same publication’s next report stated the economy was not as bad as previously thought.
It was my first hint, something was wrong.
Not until many years later, when I determined (airplane) kerosene burning at 1,800 degrees Fahrenheit, could not melt steel at 3,400 degrees; did it all become very clear. 🙂
First Rodeo?
Not for me as you have probably guessed.
If we’re going to trade/speculate profitably in this (financial collapse environment), we need to be awake.
Wandering around with delusions of P/E ratios dancing in one’s head, is not going to translate to profits.
Which brings us to the following question:
Are we in the ‘easy money’ stage of (shorting) real estate?
Is this coming Monday, going to be a continuation to the downside in earnest?
Let’s take a look at the chart of IYR and see what it says.
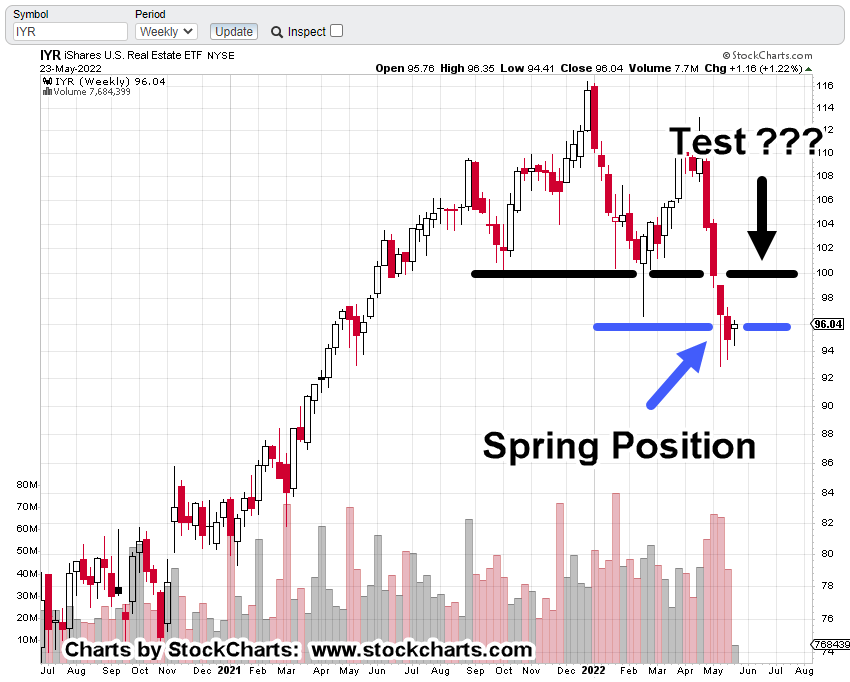
Real Estate IYR, Weekly
Technically speaking, IYR is in Wyckoff spring position (poised to move higher).
It penetrated below support and has come back to test.
The Problem Is:
Price action went straight down into support (for three-weeks, at least), penetrated, and has now come back up for a ‘test’.
Is more upside a high probability?
Short answer … No.
Could price go higher from here? Yes, anything can happen but it’s not the likely scenario.
Real Estate, IYR Daily Chart
The daily chart shows we’re still in a trading channel. Friday was/is, a test of the right-side trendline.
The smaller, hourly timeframes had their channel lines penetrated; so, we pull successively farther out (in time) to see if the overall structure has been violated.
Looking at the chart above, the channel is still in-effect.
Trading Activity
The table below, is from one of my firm’s trading spreadsheets (not advice, not a recommendation).
It’s self-explanatory, showing a very busy two weeks.
The original position remains active; with Friday’s close of DRV 46.46, that represents an open gain of, + 40%
The Day Trade on Thursday, the 12th, was an attempt to increase the line. However, as the day progressed it became obvious that a reversal (or sorts) was in the works.
That day’s position was closed along with the one opened on the 11th, for an overall gain of + 3.85%
Next Leg, Lower ?
The position opened this past Friday was in anticipation of the next leg lower.
Note: The finger is always on the sell button in case the coming week shows more IYR, upside.
However, price action of IYR itself, is showing that it’s ‘respecting’ the Fibonacci projections as shown below.
Last week’s action confirmed and bounced off the 100%, projection level.
Putting the channel back in and compressing the chart gives us the following … yikes !!!
Summary
If IYR declines to the 161.8% projection, or even farther, expect there to be plenty of panic.
We should also expect to hear from our ever-helpful financial press when they say:
‘The easy money has already been made’
That of course, would probably be true (stating the obvious) and give us a potential confirmation to exit the position.
Note: Posts on this site are for education purposes only. They provide one firm’s insight on the markets. Not investment advice. See additional disclaimer here.
If the Fed’s admitted it’s out of their hands, that means markets could operate under real price discovery for the first time, since … well, 1913.
If that’s true, future Fed meetings and their subsequent pontifications will be meaningless as far as market reaction; no matter what they do.
Wyckoff said as early as 1902, prices move by a force of their own that have no connection to real values.
Unless proven otherwise, we’ll use the ‘out of control’ paradigm on a go forward basis.
It should be noted, while moving forward with that new paradigm, there’s a massive herd still trying to figure out what the Fed ‘has to do’.
Newsflash: The Fed does not ‘have to do’ anything.
Matter of fact, they’ve already done it. The elites have made windfalls, selling (along with the Fed, itself) at the top.
Real Estate: ‘Pig in the Python’
The last update showed a trendline that’s been subsequently broken; not by much but price action has definitely pushed through.
The hourly chart of IYR, has been updated to show where we are now … just after the open.
At this juncture, price action’s in a down-channel.
Positioning
Best case scenario would be for IYR, to contact the right channel line and reverse; thus, allowing a low risk point to increase the short via DRV (not advice, not a recommendation).
That may happen this session or next … or, of course, it may not happen at all. That’s the way of the markets.
Summary
Evidence continues to pour in that real estate’s finished.
This latest post from Scott Walters has the rich selling off their luxury homes … and fast.
Note: Posts on this site are for education purposes only. They provide one firm’s insight on the markets. Not investment advice. See additional disclaimer here.